$RDD #REDDCOIN - DAILY TA - WHERE IS THE BOTTOM???

Hello Lads and Ladies,
Today we are taking a look into RDDBTC. A low satoshi value coin, yet highly traded and anticipated by many.
The first thing I have to admit here, that this coin is highly correlated with the market movement. Therefore, the chart looks like one of many other charts that we have seen in the last couple of weeks.
I have chosen to look at the daily chart because that give a nice overview about what is going on and where we are heading to.
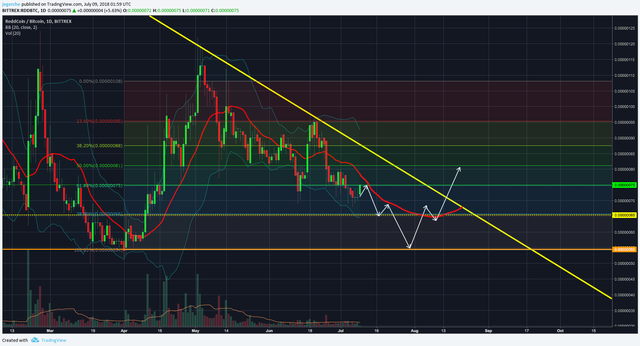
As we have seen in the last couple of weeks RDDBTC has failed to break its downtrend resistance and is still retracing. Yet, we have crossed the middle of Bollinger Bands a few weeks ago and had a very weak attempt to break it again a week ago. The goal here is to at least touch the middle of the Bollinger Bands again and then, retrace for the last time before we break it and with it the downtrend resistance.
So to make it as easy and understandable as possible, the plan is to go up a little - touch the mid of BB, then retrace again - hit the low of BB AND one of the support lines, finally bounce - break the mid of BB AND the downtrend resistance. Similar to what you see drawn in the chart.
IN NUMBERS
- BUY @60-55
- SELL @70-80-95
Make sure to check it out on Tradingview - https://www.tradingview.com/u/jegerche/
Instagram - https://www.instagram.com/bitcoin25.de/
Twitter - https://twitter.com/mreucho/
 me and you will find this page interesting because I am a TA expert and day trader that does daily updates and new posts about the hottest and most discussed coins.
Cheers, Tomas