Crypto: What Goes Up Must Come Down | Strategy Notes for the Week of April 22
If you’d rather see this presented in video form, you can view the replay of the live stream I host every Sunday night:
I will start off by first saying in no uncertain terms that we are still in a bear market. The bullish case needs to PROVE itself and should not be assumed by default.
That said, the price action of the last week has been very encouraging. Almost every altcoin increased in value with many breaking out significantly. But this is not enough. As I noted last week, creating a major higher low and then going on to higher highs is required for bull trend confirmation.
The first part of this will be focused on Bitcoin’s price action. Then I will show a few altcoin charts that are good proxies for the majority of the market. Lastly, I wrap up with the strategy that I am approaching the markets with this week.
Let’s get started!
Bitcoin
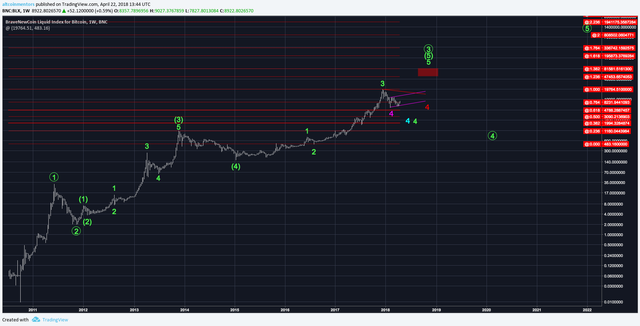
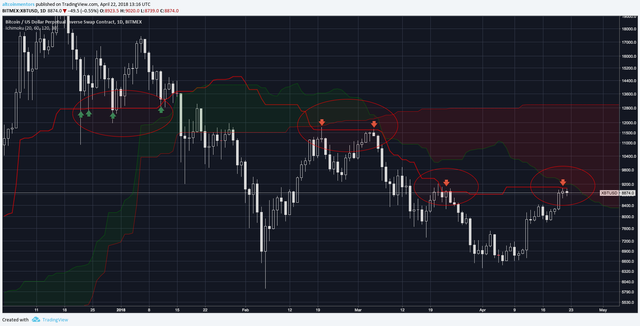
The weekly Bitcoin chart is unchanged. I am still expecting $48k to $82k by the end of this year. To change my mind, price would have to break critical support at $3000.
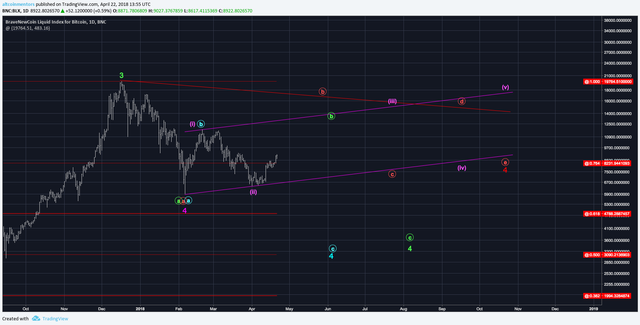
The Daily Bitcoin chart is unchanged as well. You can see how many different possibilities that Bitcoin has left us with. And I’m not even showing all of them!
The most “standard” expectation would be the green scenario, which calls for a rally up to ~$13k and then a drop to $4.8k.
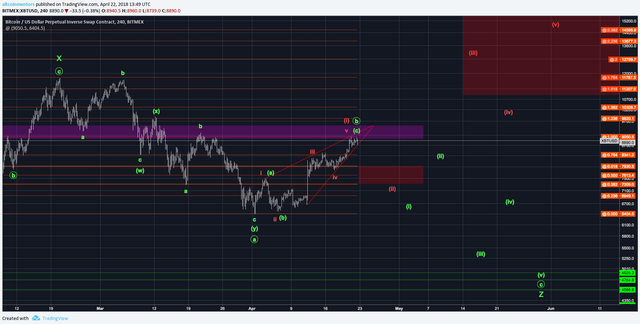
Thankfully, the Bitcoin 4 hour chart is much clearer. We are approaching HEAVY resistance in a rising wedge to complete a 5 wave structure. There is a 90% chance that we experience a 10+% correction in the next week. I would be VERY surprised if the price breaks above $9500.
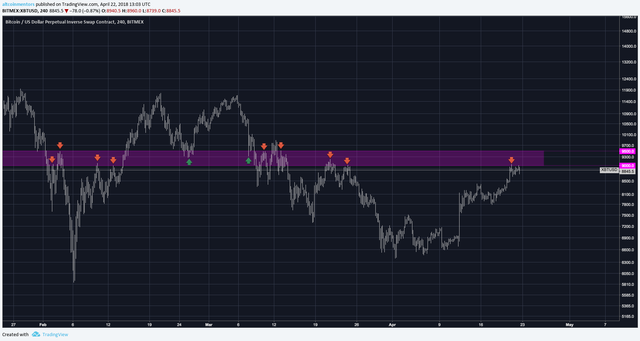
You can see that this region between $9000 and $9500 is EXTREMELY strong resistance. It has held nine times and been broken only twice.
If you are familiar with the Ichimoku Cloud, you’ll know that the Kijun (red line) acts as strong support and resistance. You can see in the chart above that it held as support many times before finally breaking and then became strong resistance. So far it has been tested three times and each touch has resulted in significant downside.
In addition, Bitcoin is approaching the cloud itself, which acts as yet another level of resistance.
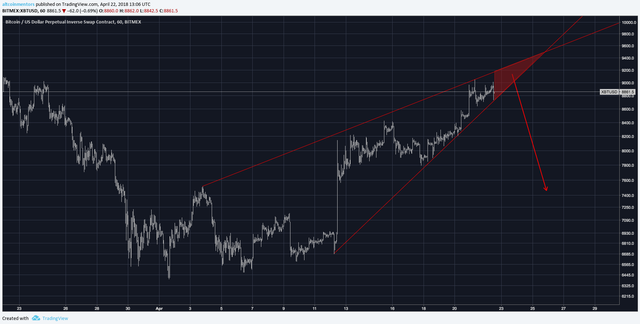
For those who prefer classical charting patterns, there is a prominent rising wedge with the apex at $9500 on April 26.
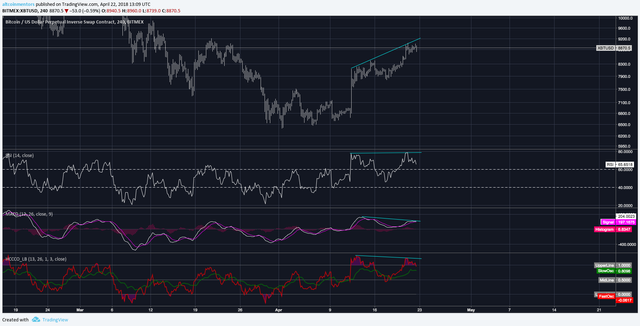
Oscillators, when used properly, will indicate when momentum is gained and lost. You can see that there is regular bearish divergence: the price is making higher highs while the oscillators have equal or lower highs.
I hope now you can see why I say that there is a 90% chance we see a correction here. Now the question is: where will it find support?

Coming back to the original chart, there is critical support around $7000 at the 78.6% retrace. If this breaks, downside to the $4000s becomes likely. However, I would say that there is only a 25% chance that this occurs. These odds are good enough for me to bet on the long side during this retrace.
Once the expected correction starts, I will place buy orders at just above the 31.8%, 50%, and 61.8% retrace levels (log scale). The lower the price, the bigger the size. My stop loss will be below the critical support mentioned above.
The exact targets will change depending on where support is gained, but the standard expectation would be $13k and $15k.
Altcoins
The majority of altcoin charts can be split into three groups: March 18 low, April 1 Low w/ incomplete structure, and April 1 Low w/ complete structure. Notable exceptions are Monaco (MCO) and Verge (XVG), which had much larger price movements due to news.
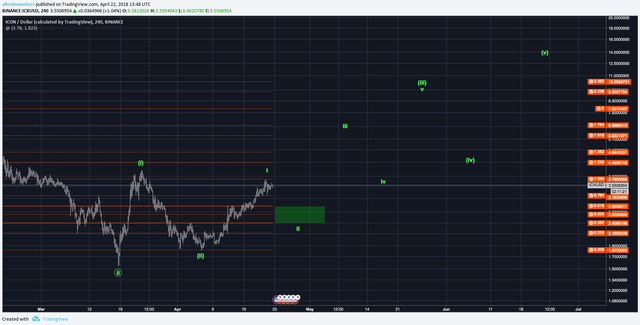
Icon (ICX) is an example of a coin that made it’s low on March 18. Other coins in this group include Enigma and EOS.
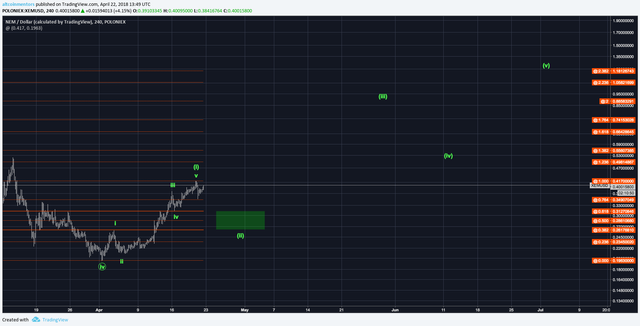
NEM (XEM) made it’s low on April 1 and has since completed a 5 wave structure. REQ, ONT, POE are some others that look similar.
These two patterns are similar to Bitcoin in that they look like they have very limited upside left. As such, I am playing them similar to Bitcoin: placing buys at the 38.2%, 50%, and 61.8% retrace levels with a stop loss under 78.6%.
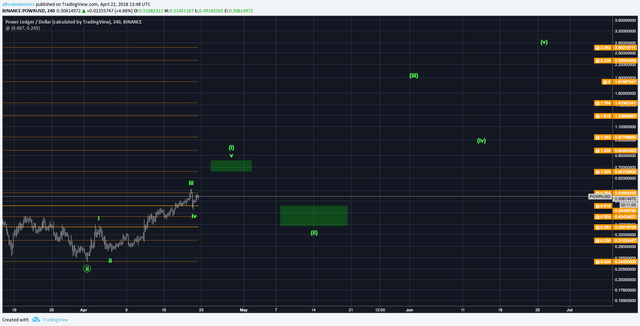
Power Ledger (POWR) is in the last and most common group where a low was hit on April 1 and the structure up is incomplete. WAN, BTS, ZIL, ARK, VEN, RLC, and many more are like this.
These are trickier in that there are two directions they can take in the next week. Some will continue to rise and complete 5 waves up while Bitcoin grinds up. These are very bullish and should be played just like the two groups above.
Others in this group will fail to make new highs and instead morph into structures that are, if not outright bearish, only slightly bullish with limited eventual upside.
Strategy
Some might read the above and think that I recommend to sell all of your crypto. This is very, very far from correct. While yes, I do think we should expect some downside, trading is all about probabilities.
We want to catch the 3rd wave (most commonly the most explosive and largest according to Elliott Wave Theory) and ride it all the way up. 2nd waves tend to vary in terms of the depth of their retrace. What you don’t want to do is sell everything at the top of wave 1, have wave 2 not retrace to your buys, and then miss out on all the upside of wave 3.
Here is what I do recommend:
If you’re like me, when you saw some of the prices on March 18 and April 1, you couldn’t help but load the boat with some of your favorites (ENG, ICX, and EOS in my case). At this point, I am HEAVILY overexposed and will be reducing these positions down to more moderate allocations.
If you want to rebalance your portfolio, take profits (or losses) and wait to enter into underexposed positions.
This also applies to positions in which you don’t believe in anymore. I know that I got sucked into hodling some shitcoins on the way down and can’t be the only one. I am cutting these positions loose to raise cash to put into winners.
If you want to be more cautious and/or are overexposed to crypto in general, HEDGE.
As you all know, we are big fans of hedging. We even made a video about it!
I currently have the majority of my net worth in crypto and thus my first rule in speculation is to not lose money (this should be your first rule anyway). I have short positions on BitMex futures that I will add to as Bitcoin increases in price and reduce as the correction starts.
If this analysis has been helpful and you want to receive it in your inbox every Sunday, you can sign up at https://altcoinmentors.com/strategy. If you would like to support us, please upvote and share this article with someone else who would find it useful!
To keep up with us during the week, we have a Telegram Channel where we post charts, market updates, and trade ideas every day! You can join by going to https://t.me/altcoinmentors.
We also have a model portfolio that contains all of the moves we are making in the market. Since we started it last month, we have significantly outperformed the crypto market. You can grab that at https://altcoinmentors.com/portfolio.
Happy trading!
Charlie You
Altcoin Mentors, Inc.
@iamcharlieyou
@altcoin_mentors
✅ @charlieyou, let me be the first to welcome you to Steemit! Congratulations on making your first post! I gave you a $.02 vote! Would you be so kind as to follow me back in return?