Market analysis of June 12, 2019
Marketcap
The marketcap has been moving up (+1.06%) since yesterday. The total capitalization is 256.296.121.716 USD.
Bitcoin totals 141.985.594.097 USD of capitalization for a dominance of 55.40%.
Ethereum's marketcap is 26.442.444.307 USD, followed by Ripple with 16.690.748.696 USD.
Market Sentiment
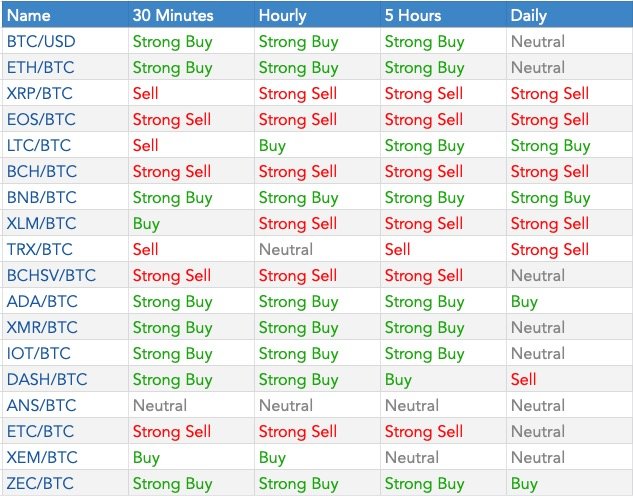
How to read the Market Sentiment?
Bitcoin
The BTC is still in its range. With an upper limit at around 8150$ and a lower limit at 7440$ (Bitstamp). It should also be noticed on the graph on the right (BTCUSD: 4hours) that there is a significant decrease in volumes. Is the BTC running out of steam?
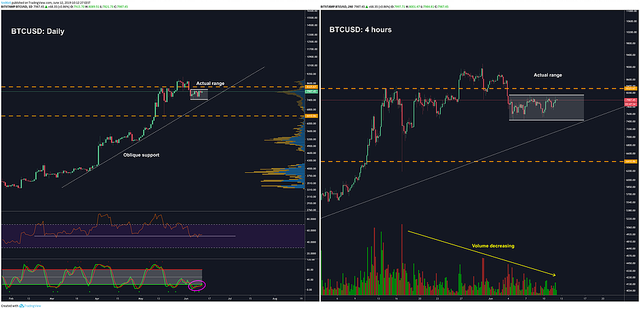
What is the current situation?
- If we step back a little bit and place ourselves in a daily timeframe, we can observe the presence of a potential long-term oblique support. The BTC could then range to this support before continuing to move up. We will also notice on this chart the reversal of the StochRSI indicator which is leaving its oversold zone (Purple Ellipse on the left chart). In addition, the RSI seems to be bouncing back on the 50 zone.
- Some traders are convinced that a fall is inevitable and see a Head & Shoulder pattern (H&S). The confirmation of this configuration would be a break of the stroke line. In this case the BTC could reach in the first place $7000 initially and then the $6,500.
What to do about it?
The situation remains unclear. We will not advise you to enter the market with a BTC that is in a range unless you are a confirmed scalper! Our advice: be patient, wait for a break with a large volume to place yourself! Thus, if you are not yet in position, we advise you to wait for a confirmed break of $8140 in the case of a rise, or a return on the support at $7440 before reassessing the situation.
- The supports of the day are at 7440$ - 7000$
- The resistances of the day are at 8150$ - 8330$
Ethereum
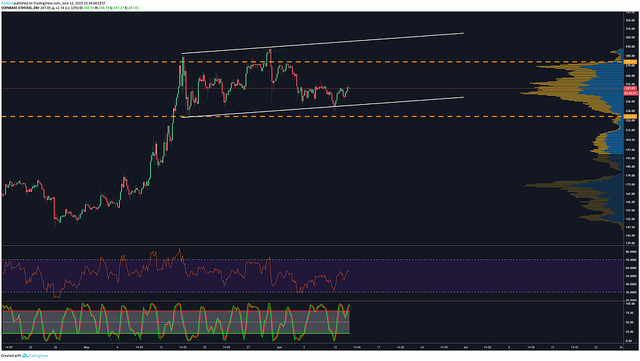
Concerning ETH, the situation is similar to yesterday. No big moves. ETH would seem to be evolving in a range as well. Wider than BTC (see: the 2 white lines). The two dotted orange dashed lines were made from the VPVR on a daily chart to identify support/resistance areas from the volume. The upper bound is $273 and the lower bound is $223
What to do about it?
If you are in position, place your stop-loss above your purchase price. If you are not in position, however, wait until the resistance breaks at $273 and a return on support at $223 before reassessing the situation.
- The supports of the day are at 232$ - 223$
- The resistances of the day are at 273$ - 295$
Conclusion
You can join us on Telegram for a follow-up of the market throughout the day.
For any question, our team will be happy to answer you on our support which is open 7/7 days.
For any information about our subscriptions, please visit our website or contact @CryptoAddictsButlerBot directly to get all the information you need.
See you tomorrow for a new market analysis ! 🚀
Congratulations @crypto-addicts! You have completed the following achievement on the Steem blockchain and have been rewarded with new badge(s) :
You can view your badges on your Steem Board and compare to others on the Steem Ranking
If you no longer want to receive notifications, reply to this comment with the word
STOPTo support your work, I also upvoted your post!
Vote for @Steemitboard as a witness to get one more award and increased upvotes!