CRYPTONITE-ELITE EOS CHARTS 3/7/2019
The chart below gives us a look at EOS's % volume of market cap (blue line) and EOS's % increase/decrease close to close (red line) for the past 30 days.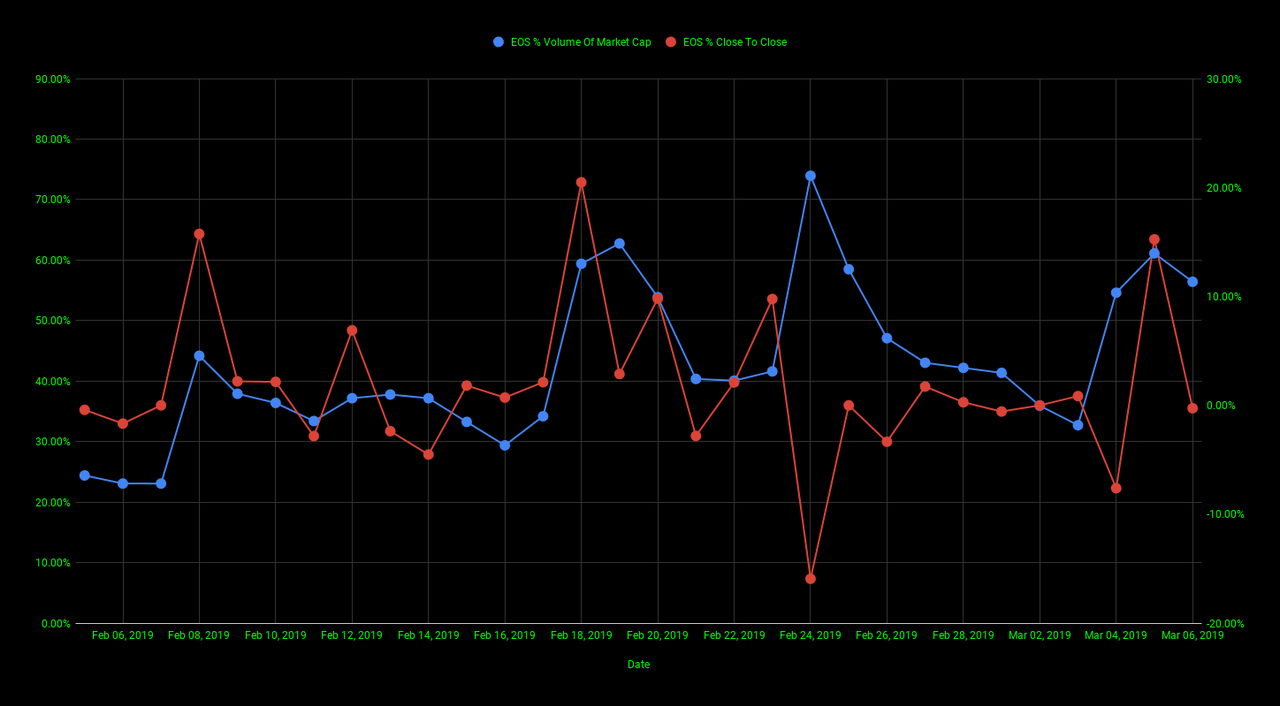
The chart below gives us a look at EOS's marketcap (blue line) and EOS's closing price (red line) for the past 30 days.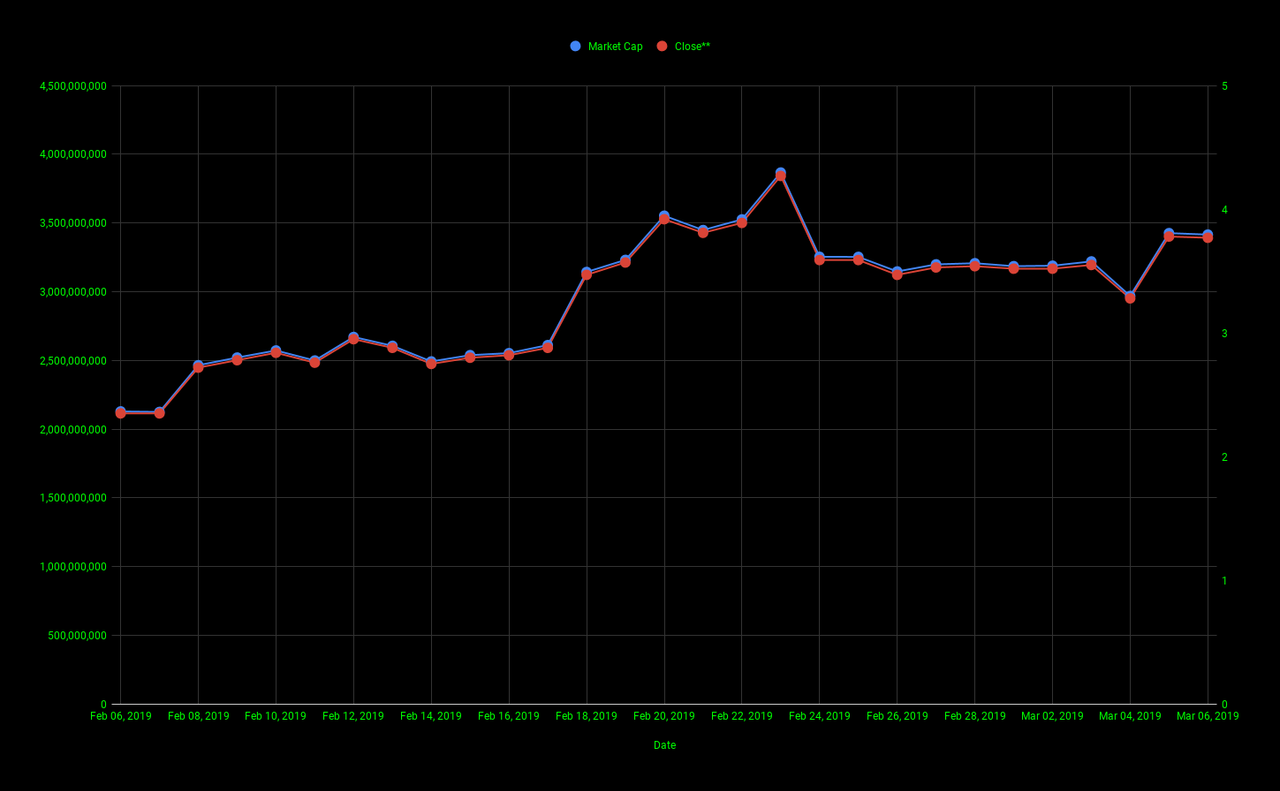
The chart below gives us a look at EOS's closing price (blue line) and EOS's volume (red line) for the past 30 days.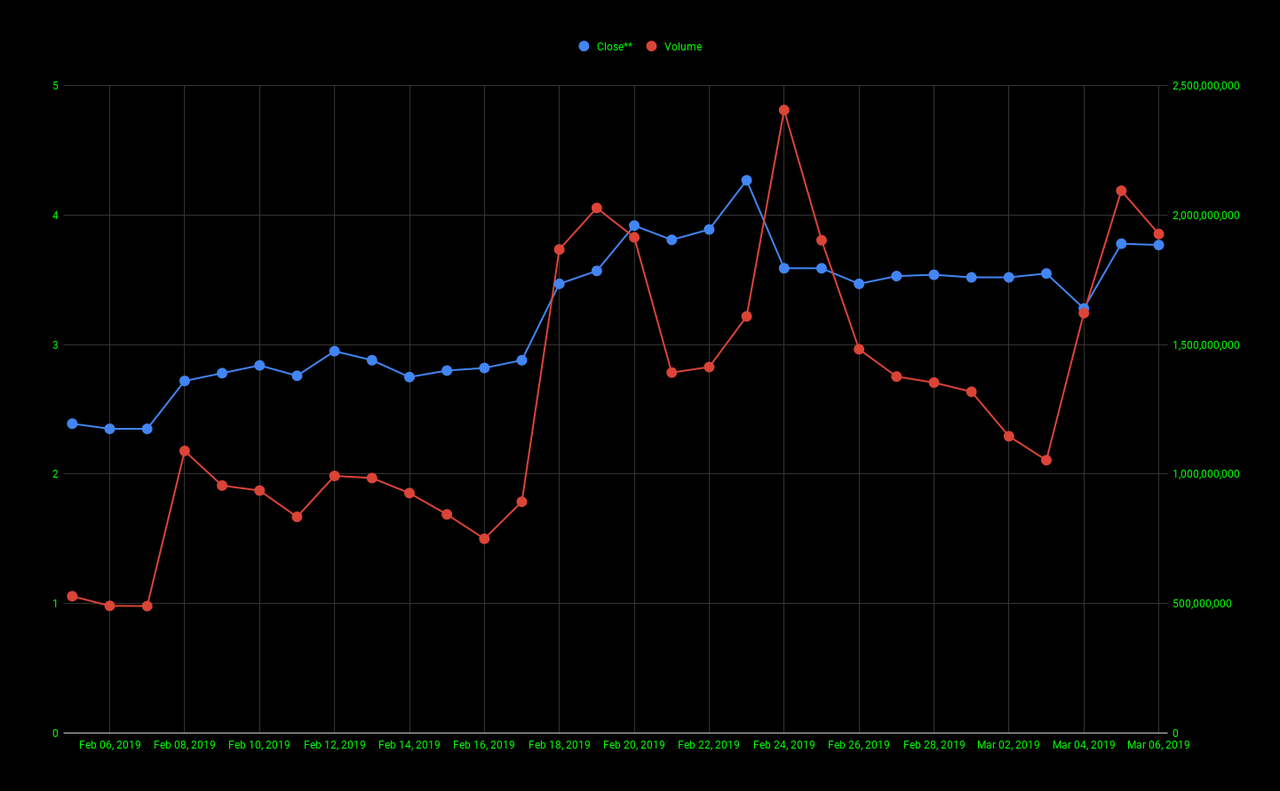
The chart below gives us a look at EOS's % increase/decrease open to open (red line), % increase/decrease high to high (yellow line), % increase/decrease low to low (green line), and % increase/decrease close to close (blue line) for the past 30 days.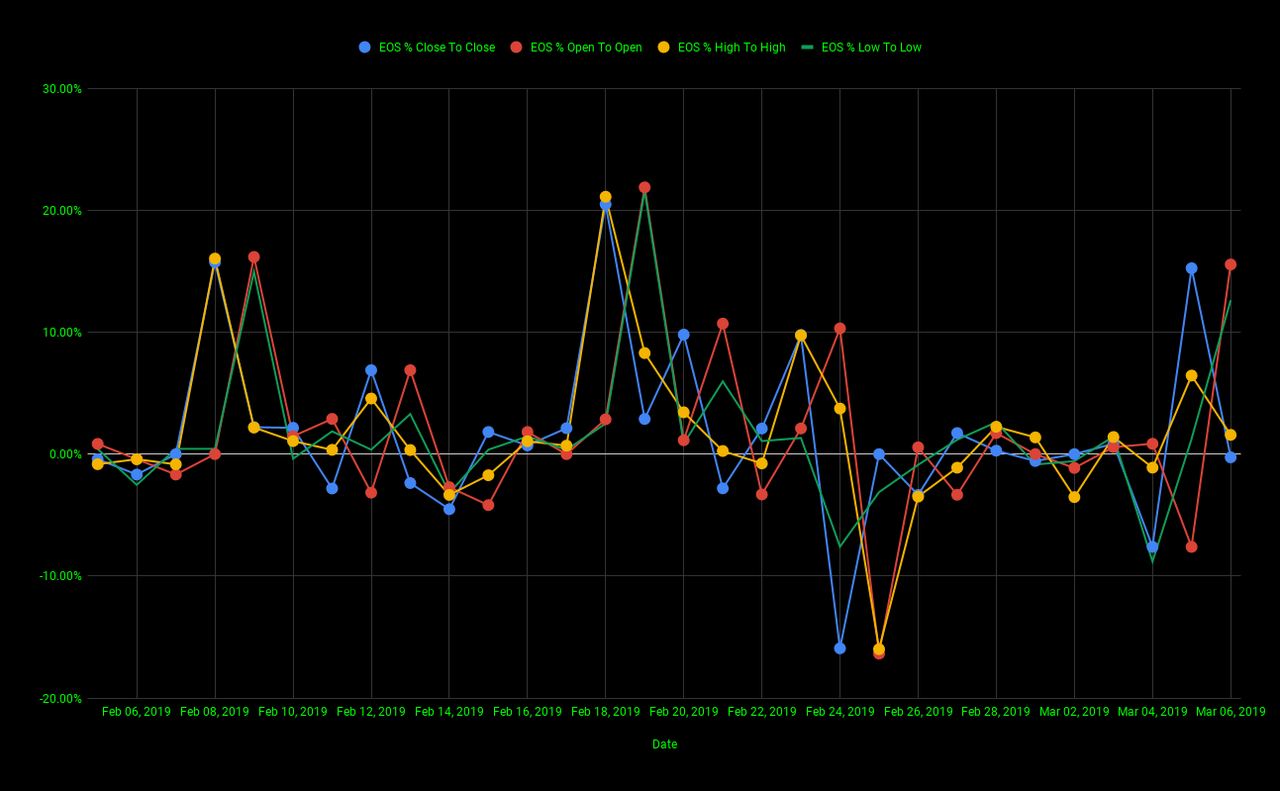
The chart below gives us a look at EOS's open (blue line), high (red line), low (yellow line), and close (green line) for the past 30 days.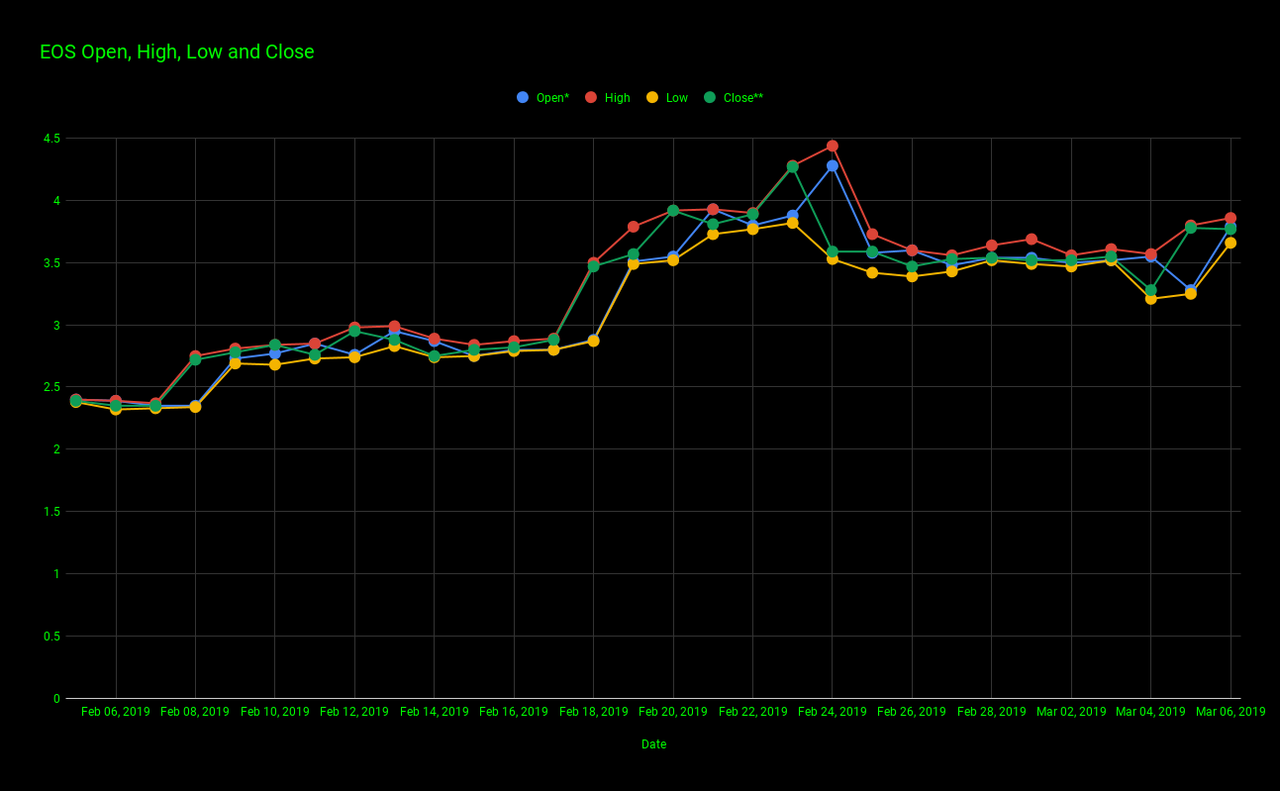
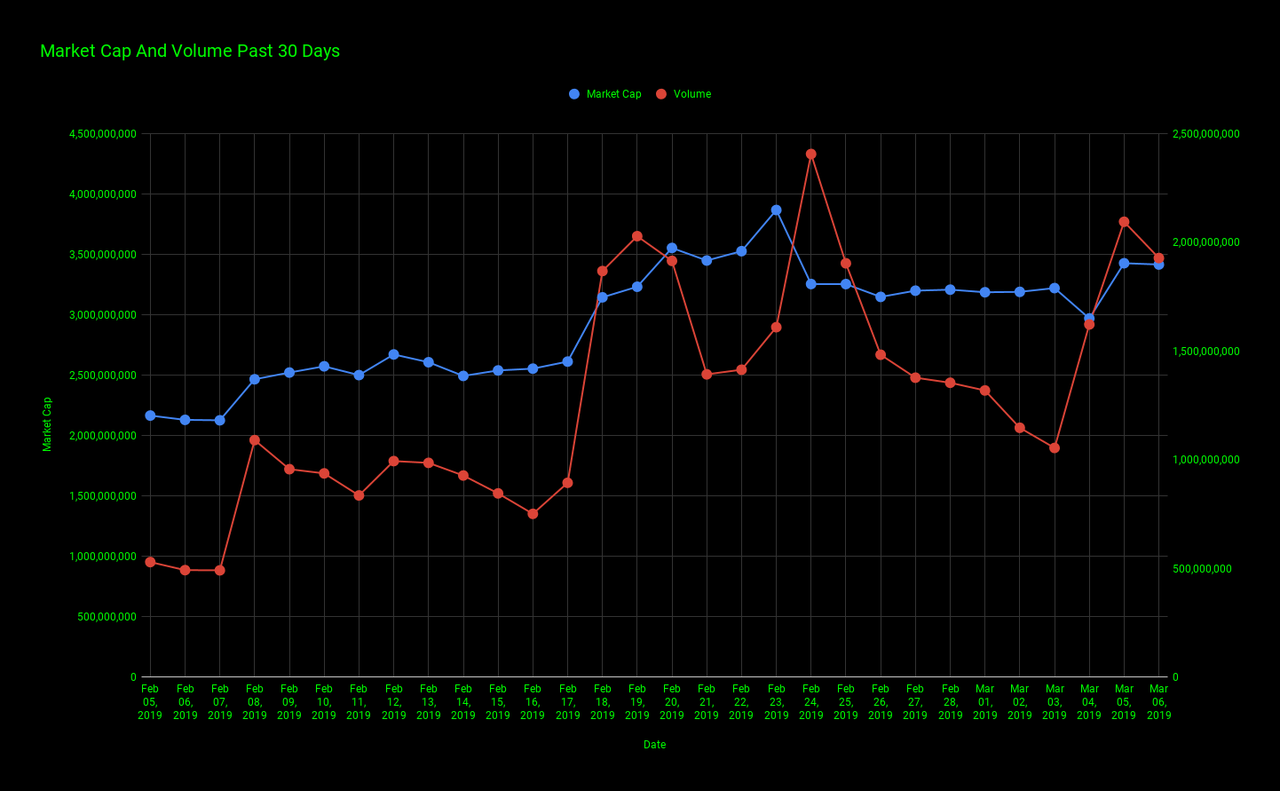
The chart below gives us a look at EOS's marketcap (blue line) and EOS's volume(red line) for the past 30 days.