Bitcoin Price Analysis - Medium-term & Short-term
BTCUSD Medium-term Trend: Ranging
Resistance: $7,600, $7,650, $7,700
Support: $7,500, $7,450, $7,400
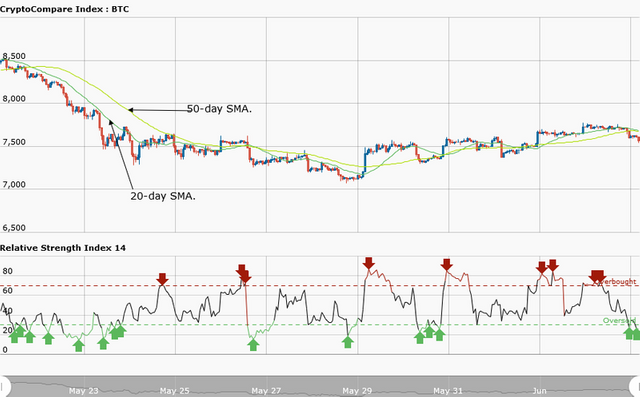
Last week, THE price of Bitcoin had been in a range bound movement all through the week. First of all, THE price of the asset was sustained above the $7,000 price level. Secondly, Bitcoin was fluctuating below and above the price of $7,500. However, the asset rose above THE $7,500 price level, and it was resisted at $7,613. It fell to the low of $7,303 and later made another attempt to come back to the high of $7,500.
The asset is currently trading at the price of $7,574.35 as at the time of writing. From the weekly chart, the asset is in a range bound movement. The asset is trading above the $7,500 price level. The bulls are still resisting at a price of $7,613; this was the exact situation the asset faced last week. As the asset is being resisted, it is likely to fall to the low of $7,303.
Meanwhile, the relative strength index period 14 is level 26 which indicates that the market is oversold - suggesting that bulls will take control of the market.
BTCUSD Short-term Trend: Ranging
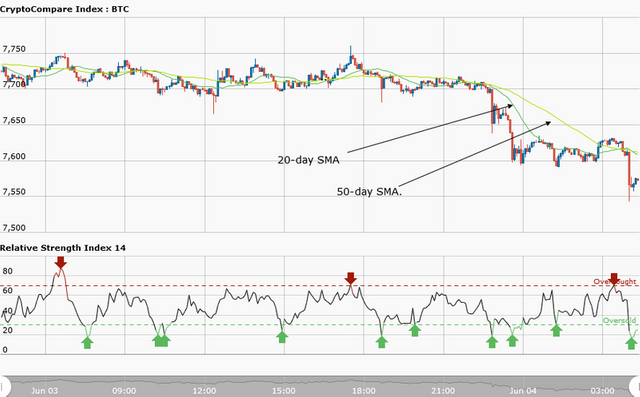
On the daily chart, the price of BTCUSD pair was consolidating at the price of $7,700 because of the resistance by the bears. The asset fell to the low of $7,550 after the range bound movement.
Posted from my blog with SteemPress : https://icoscroll.com/bitcoin-price-analysis-medium-term-short-term/
I have a feeling I read this article somewhere else. Deja Vu.