5 most important indices
Today, we'll look at five indicators that will help improve the trader's skills.
Moving Average - Moving Average
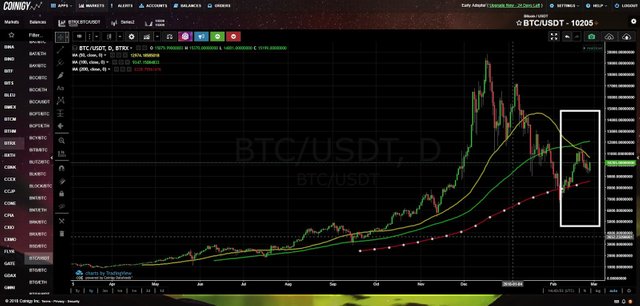
Let's start with the indicators "Moving Average". With them, you are already familiar with the previous manuals. Here I used the same settings - I put graphics on 50, 100 and 200 days. They show the average value of the price of the crypt currency at a certain time. The longer the coverage of the schedule, the stronger it is. Also indicators "moving average" is used, as a line of support or resistance. If the actual price of the coin is above the line, it is considered to be supportive. If lower - the resistance.

MACD - price fluctuations
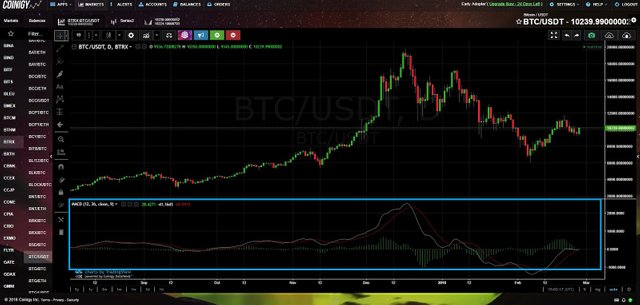
The MACD indicator is used to calculate new trends on the exchange. It appears before us in the form of a pair of lines (marked with their white and red colors) and histograms (marked in green). The closer two lines on the chart to each other, the greater the likelihood of a new trend. The further they are, the less likely a new trend. The histogram shows which trend is currently relevant. If it moves down, it goes downstream now. If this is upward - the trend is up.

Relative Strenght Index
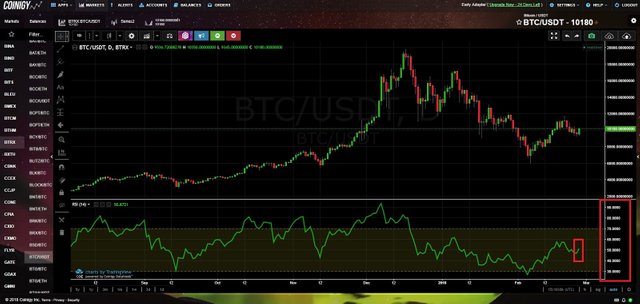
The indicator "RSI" shows whether the currency is traded at a lower, higher or normal price. The gap between the "30" and "70" indicators is an indicator of the normal price. If the price is lower, it is too low. If higher - too high. We buy low, but we try to sell too high. In the case of a normal price, look at the remaining indicators and make a decision.

Bollinger Bands
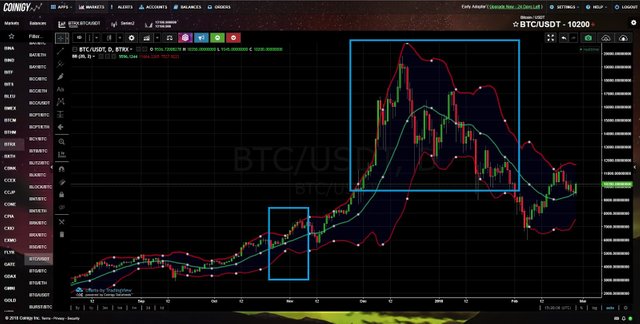
This indicator demonstrates market volatility and potential breakthroughs. On the chart, we see a moving average (green) and two borders (red). When the boundaries are close to each other, this means low market volatility, and vice versa. When borderlines converge too much, this indicates a possible breakout of the price. Buy better when the borders are closed, and sell when they are at the maximum distance.

Set of indicators
Now it will not be about the indicator, but about the merger of all the above indicators to get the most accurate information about the points of purchase and sale. Use the indicators together, but make sure they show the correct information and "allow" the transaction. If at least one parameter does not meet the requirements, it is worth considering.