Back Above $300: Is Ether Building Momentum?
The ether-US dollar (ETH/USD) exchange may be looking to regain some of its past momentum.
Ether's ongoing love affair with the psychological level of $300 continues amid low trading volume. At press time, ETH is trading in a sideways manner around the $304 level. Week-on-week, the cryptocurrency is up 4.12 percent, while on a monthly basis, the market has seen a 2 percent loss overall.
Despite trading in and around that range, the market has seen some more notable fluctuations in recent weeks. China and South Korea's respective crackdowns on the ICO funding model had an impact, with prices tumbling to a low of $198 on September 15. Markets regained their position somewhat in the days that followed.
Still, the cryptocurrency's price lags behind that of bitcoin, which is only 4.8 percent short of the market's record high. Meanwhile, ether is still down at least 30 percent from the record high of $400 set in early September.
That said, speculation is rife that fears around additional ICO restrictions from other regulators are keeping ether bulls at bay. This theory may be evident from the low volumes seen in ETH trading pairs.
Still, all is not lost as the price action analysis points to a bullish continuation pattern.
Daily chart
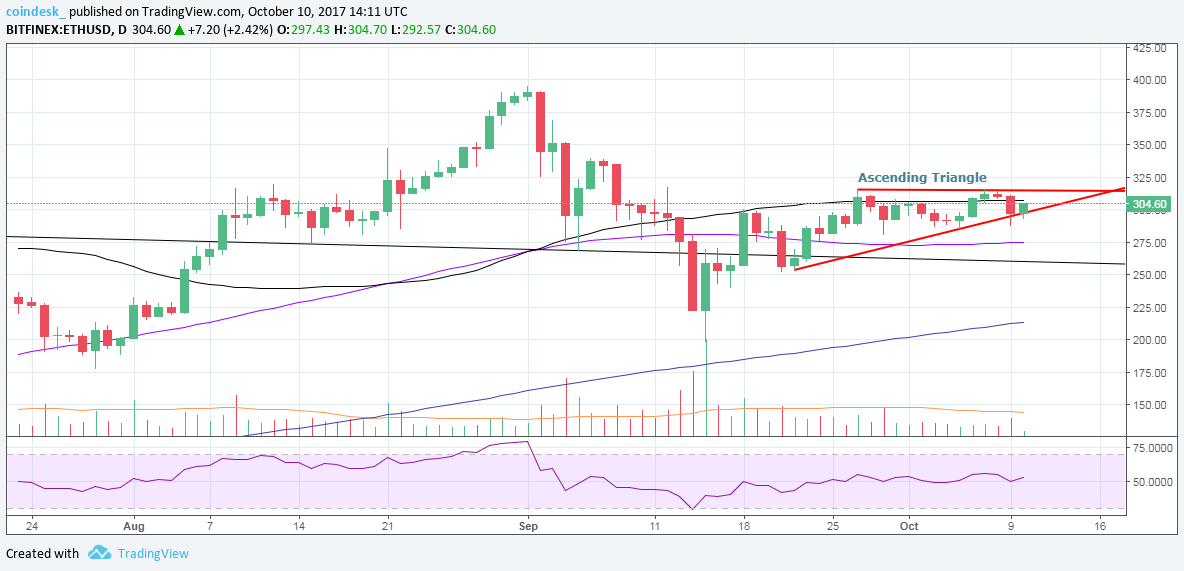
The chart above shows:
An ascending triangle pattern
A bullish 14-day relative strength index (RSI)
Weak trading volumes
Strong price resistance at $315
The ascending triangle is similar to the symmetrical triangle, except that only one side is sloping. It is characterized by a usually flat level of resistance ($315 on the ETH chart) at the top, with the lower side sloping upwards as the price reaches higher lows.
View
An end-of-the-day close above $315 (bullish break of the ascending triangle pattern) would open up an upside toward the $350 levels.
A more bearish scenario: another rejection at $315 takes place, followed by a break below $280 (the September 29 low) that could lead to a quick fire sell-off to $213 (the 200-day moving average).
It's worth noting that ascending triangles (which are characterized by higher lows) usually result in an upside break. Thus, the odds of a bullish move are high. The only concern is low volumes, although a potential upside break of the ascending triangle could entice bulls – thus leading to higher volumes in the near future.
Congratulations @fahdel! You have received a personal award!
Click on the badge to view your Board of Honor.
Do not miss the last post from @steemitboard: