Ripple Rebound? XRP Price Jumps to 7-Week High
Ripple's native XRP token jumped to a near seven-week high of $0.28 yesterday despite technical indicators that suggested the cryptocurrency's recent rally might be overdone.
While a re-test of the August 31 high of $0.26 was on the cards, the rally was something of a surprise given that the broader market is under pressure. At press time, the ripple-U.S. dollar (XRP/USD) exchange rate is up 10.47 percent at $0.27. Week-on-week, the cryptocurrency is up 33.33 percent, while month-on-month, it's up 27 percent.
Even so, XRP is well short of its record high of $0.39 set in May. As such, the present XRP rally could be a result of renewed interest among traders ahead of anticipated publicity for the company. If so, that makes the cryptocurrency vulnerable to "profit taking" following the conclusion of the event.
As of now, however, XRP bulls have no reason to fear. Price action analysis indicates the cryptocurrency is all set for a rally to possibly record highs.
Daily chart
Features • Markets News
Ripple's native XRP token jumped to a near seven-week high of $0.28 yesterday despite technical indicators that suggested the cryptocurrency's recent rally might be overdone.
While a re-test of the August 31 high of $0.26 was on the cards, the rally was something of a surprise given that the broader market is under pressure. At press time, the ripple-U.S. dollar (XRP/USD) exchange rate is up 10.47 percent at $0.27. Week-on-week, the cryptocurrency is up 33.33 percent, while month-on-month, it's up 27 percent.
Even so, XRP is well short of its record high of $0.39 set in May. As such, the present XRP rally could be a result of renewed interest among traders ahead of anticipated publicity for the company. If so, that makes the cryptocurrency vulnerable to "profit taking" following the conclusion of the event.
As of now, however, XRP bulls have no reason to fear. Price action analysis indicates the cryptocurrency is all set for a rally to possibly record highs.
Daily chart
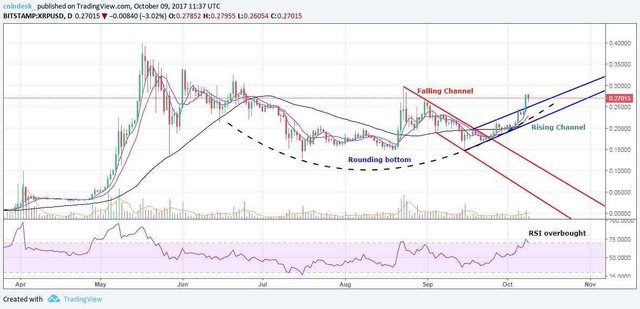
The daily chart shows:
Rounding bottom formation
Bullish rising channel breakout
Overbought 14-day relative strength index (RSI)
Five-day moving average and 10-day moving average sloping upwards
Volumes rose over the weekend, which adds credence to the bullish price action
A "rounding bottom" is a saucer-shaped formation suggesting bearish-to-bullish trend change. In XRP's case, that means the pullback after the May high of $0.39 is over and the bulls have regained control.
The overbought RSI indicates an extended move to the upside. The term "overbought" indicates a market that has advanced to a point at which, historically, it has tended to reverse and move lower.
View
Due to overbought RSI, short-term consolidation or a minor pull back to $0.25–0.24 cannot be ruled out.
The broader outlook remains constructive. XRP looks set to take out the August high of $0.2980 and test record high of $0.3988 by the year's end.
Only a drop below $0.1868 (May 30 low) would signal a long-term bullish-to-bearish trend change.