Monthly Cryptocurrency and ICO Market Analysis (February 2018)


This report presents data on the cryptocurrency and ICO market changes during 2017-2018. Special emphasis has been placed on an analysis of the changes that took place in February 2018, including over the last week (February 26-March 4, 2018).
Information as of March 4, 2018
Professor Dmitrii Kornilov, Doctor of Economics, Member of the Russian Academy of Natural Sciences, and Leading Analyst at ICOBox
Dima Zaitsev, PhD in Economics, Head of International Public Relations and Business Analytics Department Chief at ICOBox
Nick Evdokimov , Co-Founder of ICOBox
Mike Raitsyn , Co-Founder of ICOBox
Anar Babaev , Co-Founder of ICOBox
Daria Generalova, Co-Founder of ICOBox
Cryptocurrency Market Analysis (February 2018)
1. General cryptocurrency and digital assets market analysis (by week, month, quarter). Market trends.
1.1. General cryptocurrency and digital assets market analysis (by week, month).
1. General cryptocurrency and digital assets market analysis (by week, month, quarter). Market trends.
1.1. General cryptocurrency and digital assets market analysis (by week, month).
Table 1.1. Trends in capitalization of the cryptocurrency market and main cryptocurrencies from January 1, 2017, to March 4, 2018
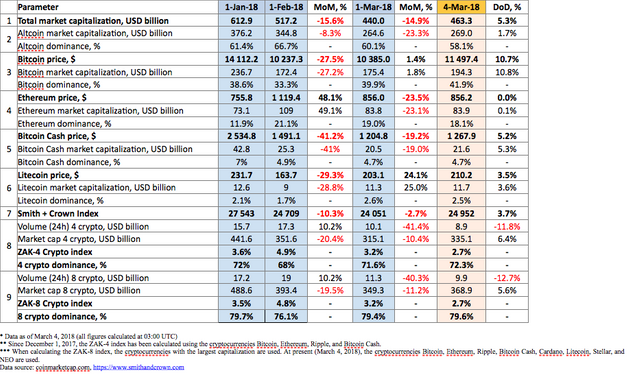
During February cryptocurrency market capitalization fell by approximately 15%, from $517.2 billion to $440 billion (see Table 1.1, as of 03:00 UTC). This was associated with the recovery of markets after a significant drop on February 6, 2018 (You will recall that the reason for the sharp fall in early February was a plummet in stock indexes (DJIA, S&P 500 Index, Nasdaq Composite, Nikkei 225, and a number of others), which decreased from February 6-10, 2018. The price of oil also fell).
The Smith + Crown Index for the month decreased slightly from 24,709 to 24,051.
The dominance of the four and eight largest cryptocurrencies as of 03:00 UTC on March 4, 2018, equaled 72.3% and 79.6%, respectively, with bitcoin dominance increasing to 41.9% (see Table 1.1).
Figure 1. Cryptocurrency market capitalization since February 1, 2018
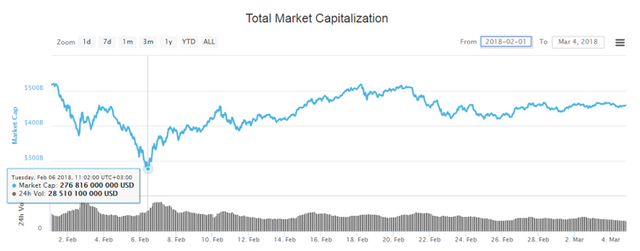
Overall, during the period from February 26-March 4, 2018, the price of 282 of the top 500 cryptocurrencies and digital assets appreciated, resulting in a growth in cryptocurrency market capitalization by approximately $25 billion.
Over the past week the number of cryptocurrencies with a capitalization of more than $1 billion increased from 24 to 25, with the price of ten of them (DigixDAO, Monero, TRON, Nano, Bitcoin, Bitcoin Cash, OmiseGO, Dash, Ethereum, NEO) climbing during this period, which is related to overall market trends.
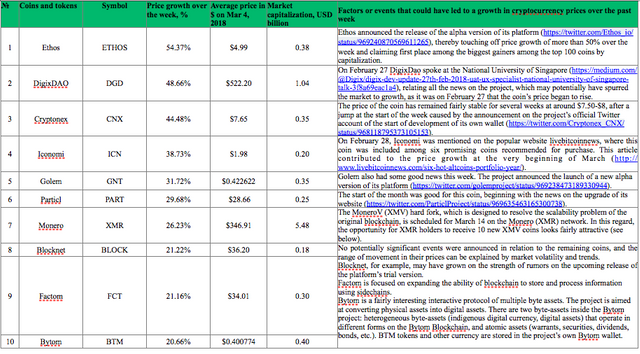
The coins and tokens from the top 100 that demonstrated the largest growth in prices are given in fig. 2.
The growth and fall of cryptocurrency prices over the past week (February 26-March 4, 2018)
The prices of some cryptocurrencies may fluctuate from -50% to +50% over the course of a single day. Therefore, when analyzing cryptocurrency price trends, it is advisable to use their average daily amounts on various cryptoexchanges.
Below we consider the top 10 cryptocurrencies that demonstrated the most significant change in price over the past week (fig. 2-3). In this regard, only those coins and tokens included in the top 100 in terms of market capitalization (according to the data of coinmarketcap.com) were considered.
Figure 2. Largest growth in prices over the past week

Tables 1.2 and 1.3 show the possible factors or events that could have influenced the fluctuation in prices for certain cryptocurrencies. Table 1.4 shows the possible factors or events that could have influenced the cryptocurrency market in general.
Table 1.2. Factors or events that could have led to a growth in cryptocurrency prices over the past week
A depreciation in price was seen for 218 coins and tokens of the top 500 cryptocurrencies and digital assets by capitalization over the past week. Fifty-six of the top 100 coins and tokens dropped in price. The ten cryptocurrencies that showed the most significant drops in price are shown in fig. 3.
Figure 3. Largest fall in prices over the past week
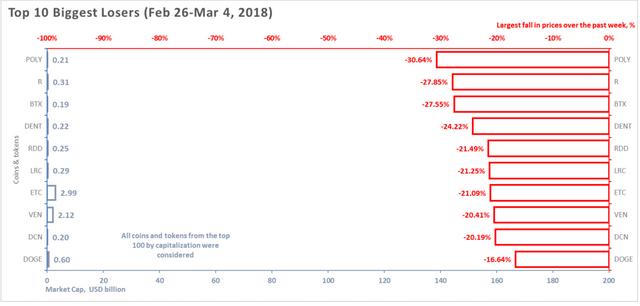
Table 1.3. Factors or events that could have led to a fall in cryptocurrency prices over the past week
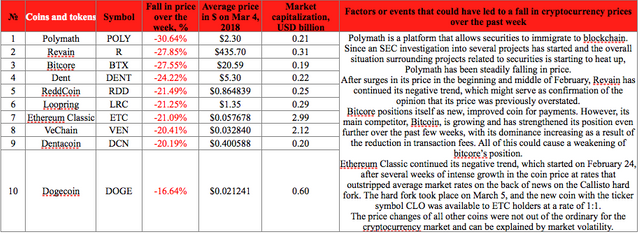
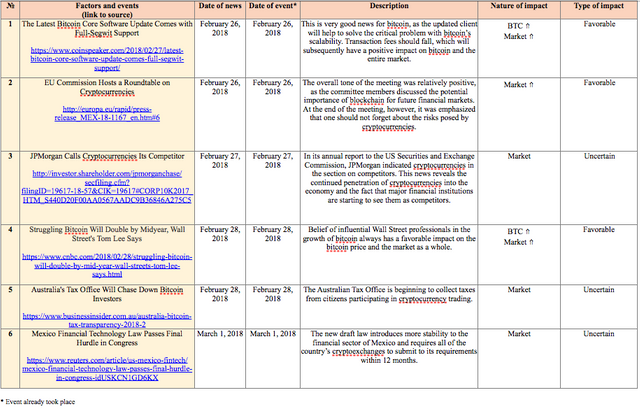
Table 1.4 shows events that took place from February 26-March 4, 2018, and had an impact on both the prices of the dominant cryptocurrencies and the market in general, with an indication of their nature and type of impact.
Table 1.4. Key events of the week having an influence on cryptocurrency prices, February 26-March 4, 2018
To analyze trading activity on cryptocurrency exchanges, the ZAK-n Crypto index is calculated (see the Glossary). The values of the ZAK-4 Crypto and ZAK-8 Crypto indices are presented in Tables 1.1, 1.5.a, and 1.5.b. For example, on February 6, 2018, the 24-hour trading volumes (Volume 24h) for the four dominant cryptocurrencies (Bitcoin, Ethereum, Bitcoin Cash, Ripple) exceeded $23 billion (Table 1.5.a). The value of the ZAK-4 Crypto equaled 10.3%, which attests to the extremely high liquidity and market dynamism of the dominant cryptocurrencies. The value of the index increased during the downturn on the cryptocurrency market (February 6, 2018), i.e. the daily turnover of cryptocurrencies exceeded 10% of their market capitalization.
Table 1.5.a. Daily ZAK-4 Crypto index calculation (from February 1, 2018, to March 4, 2018)
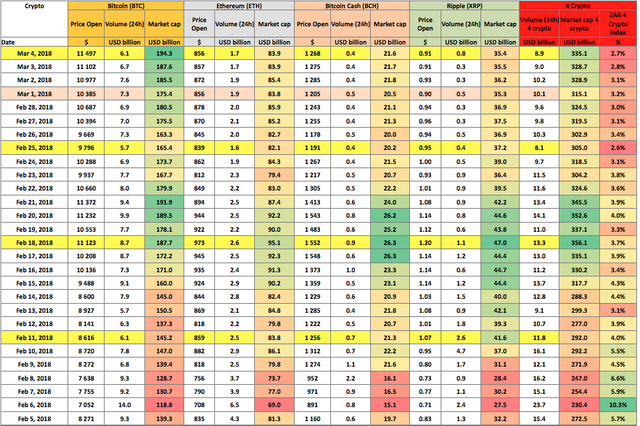
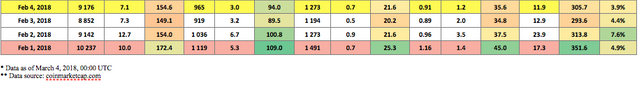
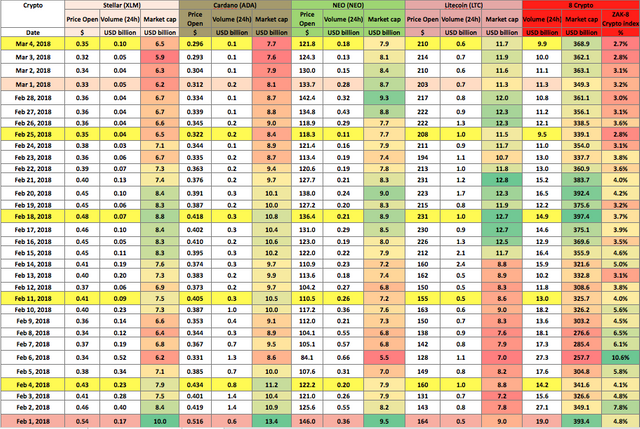
The 24-hour trading volumes (Volume 24h) for the eight dominant cryptocurrencies (Bitcoin, Ethereum, Bitcoin Cash, Ripple, Litecoin, Stellar, NEO, and Cardano) fell to $9.9 billion by the end of last week (Table 1.5.b), i.e. a mere 2.7% of their market capitalization. The ZAK-4 Crypto and ZAK-8 Crypto indices are considered in more detail in Tables 1.5.a and 1.5.b.
Table 1.5.b. Daily ZAK-8 Crypto index calculation (continuation of Table 1.5.а)
The range of the fluctuations in the Top 10 cryptocurrencies in terms of capitalization over the past month equaled more than 50% (see Table 1.6). Litecoin showed especially large fluctuations, from $105.35 to $253.9.
Table 1.6. Changes in the prices of the cryptocurrencies from the Top 10 by capitalization during the period from Feb 1 to Mar 1, 2018
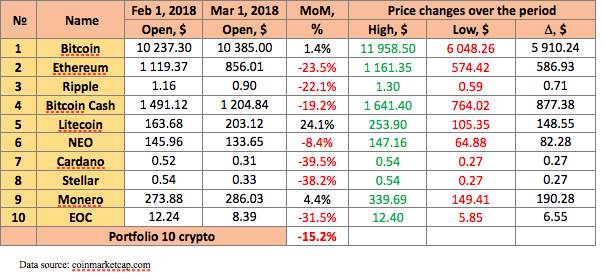
Thus, from February 1 to March 1, 2018, the ten leading cryptocurrencies by capitalization showed price changes ranging from -39.5% to +24.1% (fig. 4). An extraordinarily high correlation was seen between the prices of Cardano and Stellar (a correlation rate of more than 0.9 over the last two months). The average portfolio yield for February (Portfolio 10 crypto, consisting of the Top 10 cryptocurrencies in equal shares) was negative and equaled -15.2%.
Figure 4. Change in the prices among the Top 10 cryptocurrencies by capitalization during February 2018, %
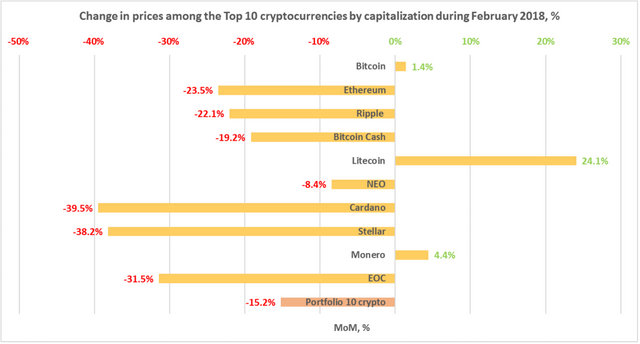
Since the beginning of February, total cryptocurrency market capitalization has fallen by 15%, from $517 billion to $440 billion at the end of the day on February 28 (https://coinmarketcap.com/charts/). This was a volatile month for the market, with the fluctuation in capitalization reaching minus 47% for a week, when total capitalization fell to $277 billion on February 6. After a very poor first week of February, the market started to show a moderate positive trend and reached the level of the beginning of month on February 18. However, by the end of the month total capitalization had still fallen by 15%. Most of the coins from the top 10 in terms of capitalization fluctuated in line with market volatility, and adhered to the overall negative trend on the cryptocurrency market. However, the Bitcoin price ultimately even increased by 1.4% during February, while the price of the majority of altcoins from the top 10 fell by more than 15%, with the exception of Litecoin and Monero (fig. 4, Table 1.6).
Bitcoin set the tone for the market in the first half of the month, with altcoins mimicking its movement, and bitcoin dominance hovering around 35%. However, bitcoin began to show better than average market growth after February 15, and altcoin growth was unable to keep up, leading to bitcoin holding 40% of the market by the end of the month. After February 6, which was a lamentable day for the entire market, this bitcoin recovery, which outperformed market trends, was caused to a large extent by the significant fall in transfer fees within the bitcoin network due to the ever more prevalent use by major players of new technologies for better scalability. For example, on February 20 Coinbase and Bitfinex announced the integration of SegWit. February turned out to be much more successful for Litecoin than for the other coins from the top 10, with this coin managing to demonstrate +24.1% growth despite negative market trends.
This can largely be explained by one day, February 14, when the Litecoin price increased by more than 35%. By the end of the day on February 15 it was trading at around $215 and stayed there for the rest of the month. This leap was the result of the announcement on February 13 of the new Litepay payments infrastructure for Litecoin. There were no major undeniably positive events regarding Monero in February, except for several small favorable announcements of new partners accepting Monero, such as, for example, this jewelry company. That being said, the MoneroV (XMV) hard fork is scheduled for March 14 in the Monero (XMR) network. This hard fork is intended to resolve the scalability problem of the original blockchain. In this regard, the opportunity for XMR holders to receive 10 new XMV coins looks fairly attractive. It should be noted that at present there are 15,786,831 XMR coins in circulation, while the total issue of MoneroV (XMV) will equal 256 million coins.
The largest falls among the top 10 coins in terms of capitalization this month were seen for Cardano (-39.5%), Stellar (-38.2%), and EOS (-31.5%). Cardano had a very hard time recovering after the market plunge on February 6, and was unable to begin a positive trend. The trading volumes are still relatively low compared to the start of the month, pointing to a total loss of interest of market participants in this coin. The Stellar price also mimicked market movements, and lost the interest of market players in the second half of February. By the end of the month, 24-hour trading volumes ranged from $35-45 million, which is very small for a coin with a capitalization of $6 billion at the end of February. The other coins from the top 10 (Ethereum, Ripple, Bitcoin Cash, and NEO) also repeated the negative market trends caused by the continuing adjustment and negative news items, such as, for example, China blocking access to all foreign cryptoexchanges on February 6. Nevertheless, NEO showed somewhat better indicators, falling by only 8% over the month, due to the major positive news that the Weiss rating agency had assigned an A rating to the NEO cryptocurrency on February 26, triggering a growth of 15%. We remind you that this was the first time that an A rating had ever been assigned to cryptocurrencies. The airdrop of Ontology tokens among NEO token holders also undoubtedly had a positive effect on the price of NEO. The free distribution to NEO holders of the Ontology (ONT) tokens at a rate of 0.2 ONT for every NEO was planned after March 1 (granted, the ability to dispose of 50% of the Ontology tokens will be “frozen”, due to a temporary block).
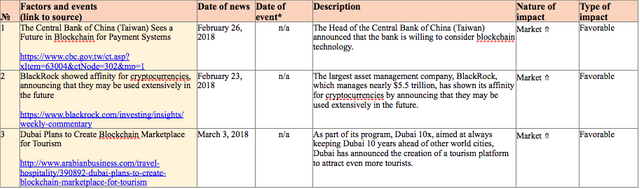
Table 1.7 gives a list of events, information on which appeared last week, which could impact both the prices of specific cryptocurrencies and the market in general.
Table 1.7. Events that could have an influence on cryptocurrency prices in the future
1.2. Market trends
The weekly cryptocurrency and digital asset market trends from October 1, 2017, to March 4, 2018, are presented as graphs (Fig. 1.1-1.5)*.
Table 1.8. Legends and descriptions of the graphs
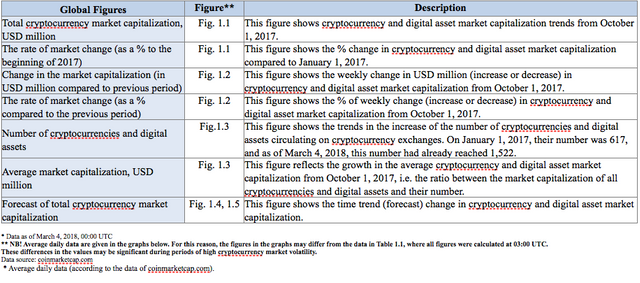
Figure 1.1. Total cryptocurrency market capitalization
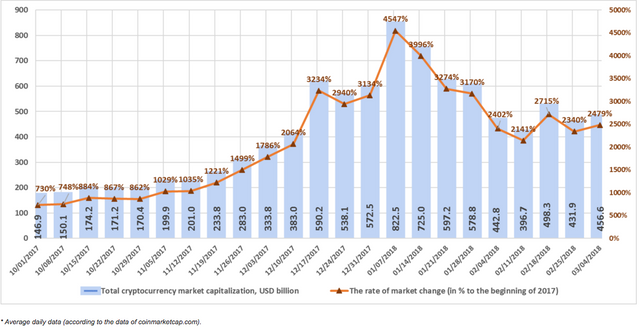
Figure 1.1 shows a graph of the weekly cryptocurrency market change from October 1, 2017, to March 4, 2018. Over this period, market capitalization increased from $146.9 billion to $456.6 billion, and a growth of 2,479% relative to the start of 2017. Over the past week (February 26-March 4, 2018), capitalization increased from $431.9 billion to $456.6 billion (as of March 4, 2018, based on the average figures from coinmarketcap.com).
** Figure 1.2. Change in market capitalization**
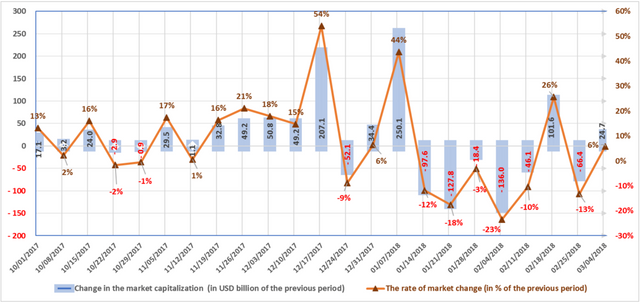
The market is susceptible to sudden and drastic fluctuations. The highest growth rate in Q4 2017 (December 17-24, 2017) was around $200 billion, or 54%. During the first week of January, market capitalization increased by approximately $250 billion, or 44%.
Last week the market increased by $24.7 billion, or 6% (with due account of average daily data, see fig. 1.2).
Figure 1.3. Number of cryptocurrencies and digital assets
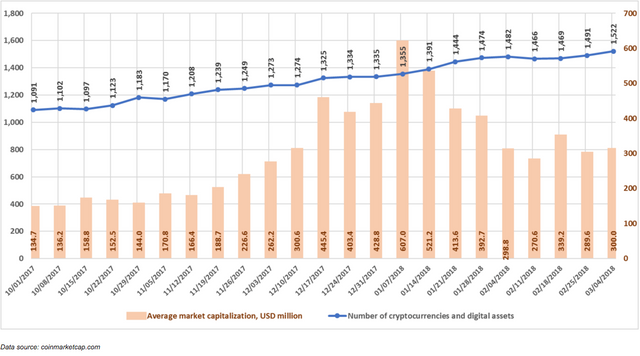
Since the beginning of October 2017, the total number of cryptocurrencies and digital assets considered when calculating market capitalization has increased from 1,091 to 1,522. Over the last week, the number of cryptocurrencies and digital assets increased by 31, from 1,491 to 1,522. That being said, their average capitalization increased from $289.6 million to $300 million.
Over the past month, 55 new coins and tokens have appeared on coinmarketcap.com, but it should be noted that a number of other coins and tokens were also excluded from the list.
Figures 1.4 and 1.5. Forecast of total cryptocurrency market capitalization
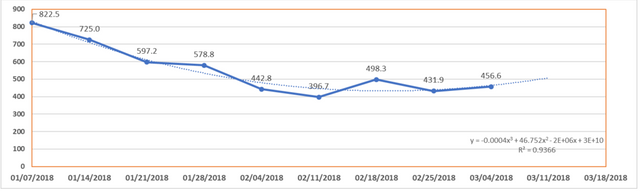
From the middle of January and throughout February the market was susceptible to sharp drops and gradual recovery. Capitalization is currently ¾ (three-fourths) of the value of cryptocurrencies at the beginning of 2018.
The middle of January and February demonstrated the extremely high correlation between the prices of most of the Top 100 cryptocurrencies and total cryptocurrency market capitalization during a period of downward adjustment. Bitcoin’s gradual recovery of its position should be noted. Its dominance has begun to grow, and exceeds 40%.
You will recall that its dominance fell abruptly, by nearly half to 33%, in the second week of January, i.e. Bitcoin was the harbinger of the subsequent serious downward adjustment of the entire market. Most cryptocurrencies follow its lead, with a certain lag time.
Therefore, one can conclude that the growth in Bitcoin will serve as an impetus for the recovery of other cryptocurrencies.
ICO Market Analysis (February 2018)
1. General analysis of the ICO market (by week, month)
1.1.Brief overview of ICO market trends
1. General analysis of the ICO market (by week, month)
1.1.Brief overview of ICO market trends
Table 1.1. Brief ICO market overview, key events, news for the week of February 26-March4, 2018
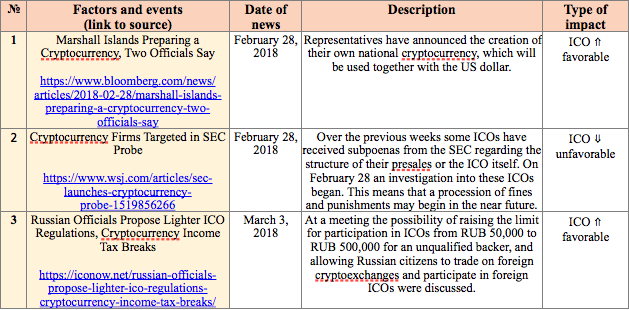
Table 1.2 shows the development trends on the ICO market since 2017. Only popular and/or successfully completed ICOs (i.e. ICOs which managed to collect the minimum declared amount of funds) and/or ICOs listed on exchanges were considered.
Table 1.2. Aggregated trends and performance indicators of past (completed) ICOs1
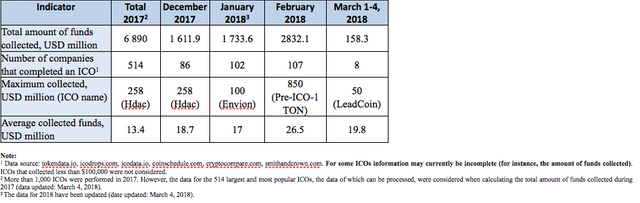
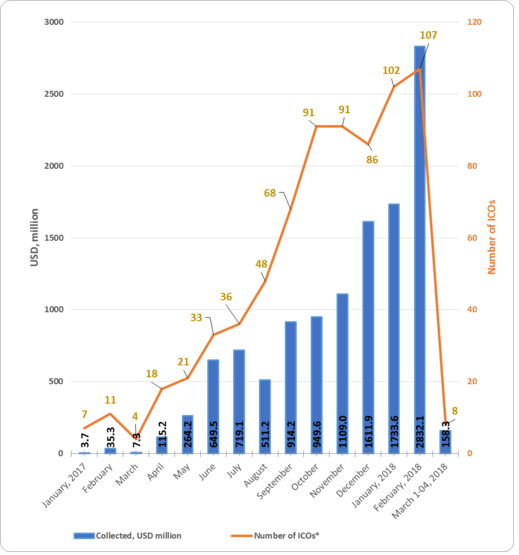
The data for 2017 and for January and February 2018 were adjusted to account for the appearance of more complete information on past ICOs. The amount of funds collected during the first days of March equaled $158.3 million (see Tables 1.2, 1.3).
Table 1.3. Amount of funds collected and number of ICOs
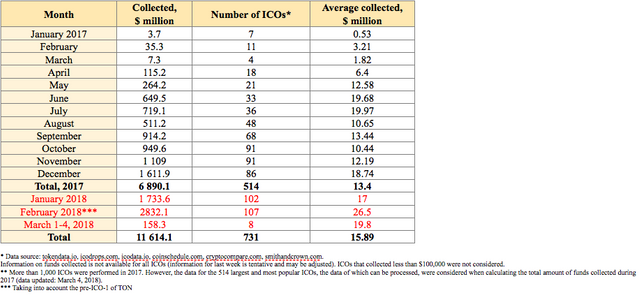
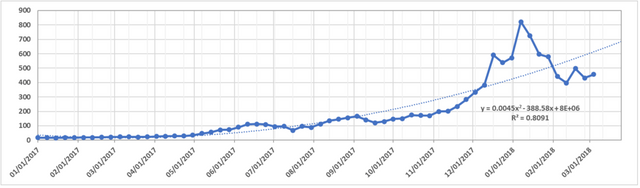
Table 1.3 shows that the largest amount of funds was collected via ICOs in February 2018. The highest average collected funds per ICO was also seen in February 2018.
Figure 1.1. Trends in funds collected and number of ICOs since the start of 2017
1.2. Top ICOs of last week
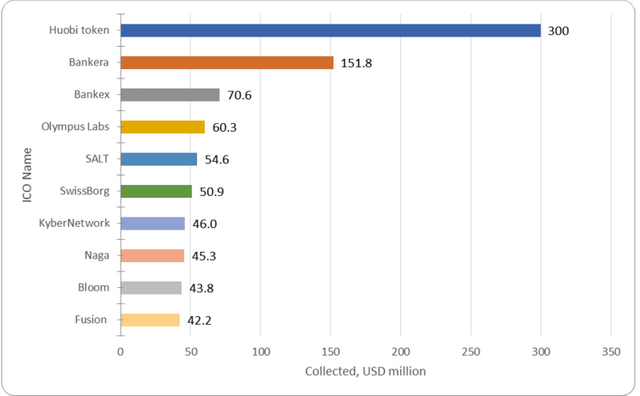
Last week (February 26-March 4, 2018) the amount of funds collected equaled $901.5 million. This amount includes the results of 35 successfully completed ICO. In this regard, the largest amount of funds collected equaled $300 million (Huobi token ICO). The average funds collected per project equaled $25.8 million (Table 1.4).
Table 1.4. Top 10 ICOs in terms of the amount of funds collected (Feb 26-Mar 4, 2018)
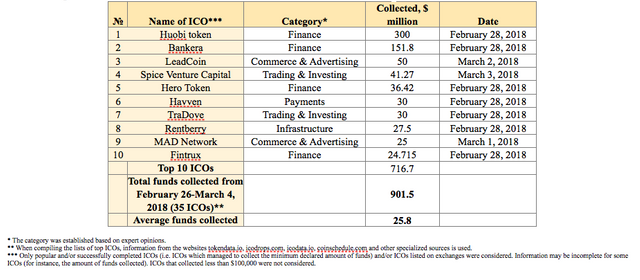
The data for last week (February 26-March 4, 2018) may be adjusted as information on the amounts of funds collected by completed ICOs is finalized.
Table 1.4 shows the top 10 ICOs which were successfully completed during the period February 26-March 4, 2018. The leader for the week was the Huobi token (HT) project, which was performed by the developers of the Huobi exchange.
The HT tokens issued are an additional tool for trading and payment of transaction fees on the exchange. The project is a sort of successor to similar projects implemented on the Binance exchange, and just recently on EXMO.
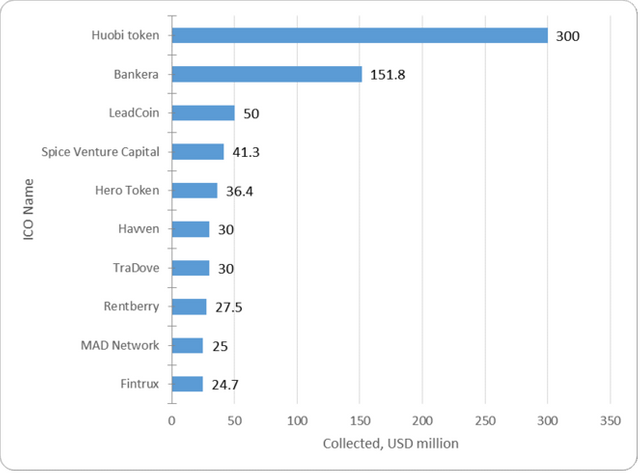
Figure 1.2 presents the ten largest ICOs completed last week.
Figure 1.2. Top 10 ICOs in terms of the amount of funds collected (February 26-March 4, 2018)
1.3. Top ICOs in their categories
The list of top ICOs by category is compiled with due account of the categories of the leading ICOs for the week.
Table 1.5. Top 10 ICOs in terms of the amount of funds collected, Finance category
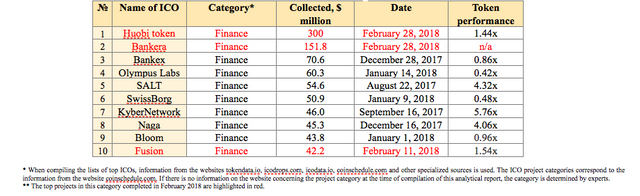
The Huobi token and Bankera projects, the leaders of the last week, head up the list of the top 10 ICOs in the Finance category.
At present, all projects from the top 10 in the Finance category have a token performance indicator of 0.42x to 5.76x. Three projects in the top 10 completed their ICOs in February 2018. The KyberNetwork ICO can be considered one of the most successful exchange listings, as this project has a current token price to token sale price ratio of 5.76x. When considering this indicator, it is important to remember that the KyberNetwork ICO was completed on September 16, 2017, i.e. the 5.76x growth took place over five months. The market capitalization of KyberNetwork currently exceeds $275 million.
Figure 1.3. Top 10 ICOs in terms of the amount of funds collected, Finance category
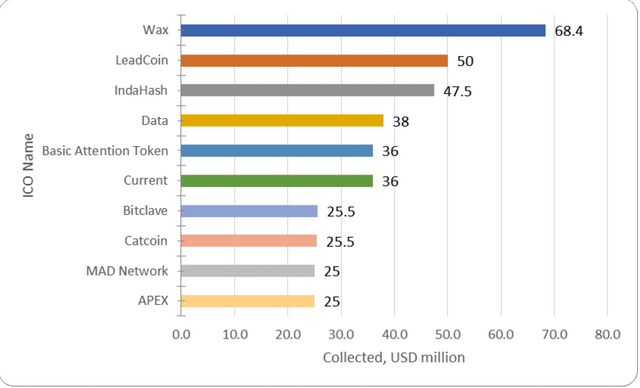
In February and March, the ICOs of three projects that can be assigned to the top 10 in the Commerce & Advertising category were also completed.
Table 1.6. Top 10 ICOs in terms of the amount of funds collected, Commerce & Advertising category
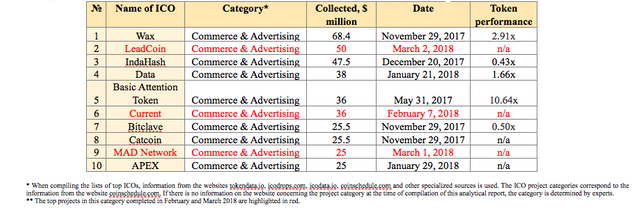
At present, the Wax project has the largest amount of collected funds in the Commerce & Advertising category. From among the top 10 projects, the Basic Attention Token ICO has the best token performance indicator. Its market capitalization currently exceeds $375 million.
Figure 1.4. Top 10 ICOs in terms of the amount of funds collected, Commerce & Advertising category
1.4. Top ICOs during February 2018
Table 1.7. Top 10 ICOs in terms of the amount of funds collected during February 2018

The three leaders in terms of the amount of funds collected came from projects traditionally assigned to categories such as Finance and Infrastructure. At present, all the projects in the top 10 for February 2018 have a token performance indicator of 0.31x to 2.23x. The ArcBlock ICO can be considered one of the most successful exchange listings, as this project has a current token price to token sale price ratio of 2.23x. When considering this indicator, it is important to remember that the ArcBlock ICO was completed on February 4, 2018, i.e. the 2.23x growth took place over a month against the backdrop of a fall in total cryptocurrency market capitalization over this period by approximately 15%.
Figure 1.5. Top 10 ICOs in terms of the amount of funds collected during February 2018
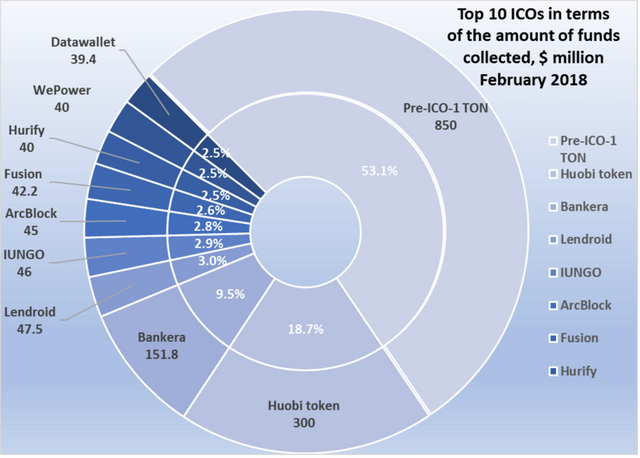
In February 2018 the amount of funds collected via ICOs approached $3 billion, reaching a record amount of $2,832.1 million (and that is without the El Petro pre-ICO, which runs until March 19). A total of 108 ICOs were performed during February, including the pre-ICO-1 of TON, which already collected $850 million during the first stage.
Last week (February 26-March 4, 2018) at least 35 ICO projects were successfully completed, each of which collected more than $100,000, with a total amount of funds collected of more than $900 million. Last week’s leader was the Huobi token project ($300 million). The total amount of funds collected by a number of ICOs failed to reach even the $100,000 mark (the information for some projects is still being finalized).
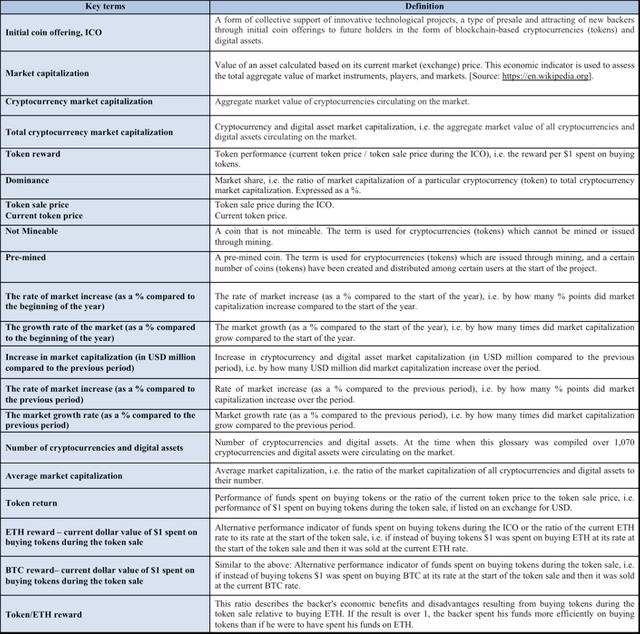
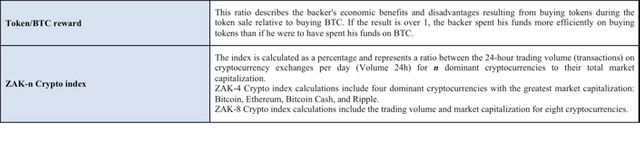
The Glossary is given in the Annex 1.
Annex 1
Glossary