Quarterly Cryptocurrency and ICO Market Analysis (Q3 2018)

This report presents data on cryptocurrency and ICO market changes during 2018. Special emphasis has been placed on an analysis of the changes that took place in the third quarter of 2018.
Information as of October 2, 2018
Professor Dmitrii Kornilov, Doctor of Economics, Member of the Russian Academy of Natural Sciences, and Leading Analyst at ICOBox
Dima Zaitsev, PhD in Economics, Head of International Public Relations and Business Analytics Department Chief at ICOBox
Nick Evdokimov , Co-Founder of ICOBox
Anar Babaev , Co-Founder of ICOBox
Daria Generalova, Co-Founder of ICOBox
Quarterly Cryptocurrency Market Analysis (Q3 2018)
1.General cryptocurrency and digital assets market analysis. Market trends.
1.1. General cryptocurrency and digital assets market analysis.
1.General cryptocurrency and digital assets market analysis. Market trends.
1.1. General cryptocurrency and digital assets market analysis.
Table 1.1. Trends in capitalization of the cryptocurrency market and main cryptocurrencies from January 1-October 1, 2018
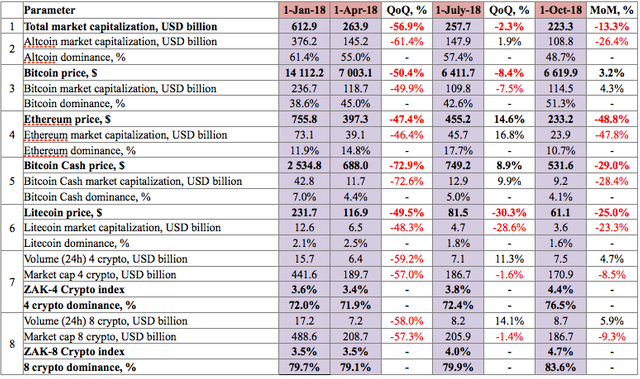

Cryptocurrency market capitalization was more than halved during the first quarter of 2018 (see Table 1.1, Fig. 1), and during the second and third quarters it dropped by another 2.3% and 13.3%, respectively.
In the third quarter capitalization fell from $257.7 billion to $223.3 billion, i.e. by $34.4 billion. In this regard, the aggregate impact of altcoins on the change in capitalization was negative, while bitcoin, on the contrary, had a positive impact. Ultimately, the decline due to altcoins equaled -$39.1 billion, and the growth due to bitcoin equaled +$4.7 billion. As a net result, bitcoin dominance increased during the third quarter from 42.6% to 51.3% (see Table 1.1).
The dominance of the four and eight largest cryptocurrencies during the third quarter increased to 76.5% and 83.6%, respectively (at 03:00 UTC on October 1, 2018).
During the third quarter cryptocurrency market capitalization fluctuated from $303.4 billion (max) to $186.6 billion (min) (Fig. 1a), i.e. within a range of $116.8 billion. For its part, bitcoin capitalization fluctuated from $143.8 billion (max) to $103.3 billion (min), i.e. within a range of $40.5 billion.
The most significant changes in the capitalization of the cryptocurrency market and bitcoin during the third quarter of 2018 are shown in Fig. 1a and Fig. 1b. These changes were related to numerous events (see the comments below and in Table 1.4).
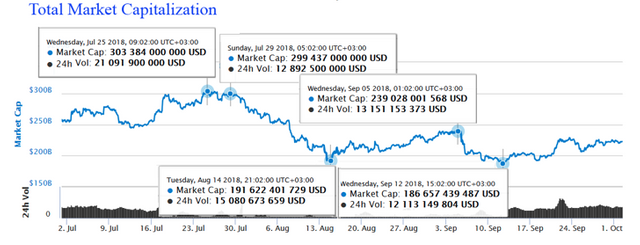
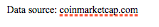
Figure 1a. Cryptocurrency market capitalization since July 1, 2018
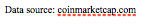
Figure 1b. Capitalization and the bitcoin price since July 1, 2018
The upward trend stalled on July 24, and from the start of August a clear downward trend has been seen (Fig. 1a and Fig 1b). As reported by the Coindesk website on August 7, based on official published information the US Securities and Exchange Commission (SEC) postponed the decision on the VanEck and SolidX bitcoin ETF until the autumn. This information once again influenced cryptocurrency prices, with market capitalization dropping over the course of a day by $35 billion. We note that the SEC had previously rejected all applications on the issue of bitcoin ETFs. The SEC also requested input on the application from the Chicago Board Options Exchange (CBOE Global Markets). In our report dated July 30, we looked at examples of the impact of the previous two official announcements of the SEC (1, 2). The first, dated July 24, states that the decisions on the five applications on the issue of bitcoin ETFs submitted by the company Direxion had been postponed until September 21. In the second announcement dated July 26 the SEC rejected for the second time the application of the brothers Cameron and Tyler Winklevoss (the Bats BZX Exchange, Inc. (BZX)) on the creation of an exchange investment fund tied to bitcoin (Winklevoss Bitcoin Trust).
Price changes during Q3 2018 among the leaders of the cryptocurrency market
Table 1.2 shows the price change for 10 cryptocurrencies during Q3 2018 (not including Tether).
The price fluctuation index (High/Low) equaled from 1.41 to 3.13. Bitcoin had the most stable price among the ten presented currencies. Its price fluctuated in a range from $8,424.27 to $5,971.05 (with due account of the average figures from the coinmarketcap.com website), and the High/Low index was 8,424.27/5,971.05=1.24. Cardano, IOTA, Ripple and Ethereum experienced especially significant fluctuations. The high and low prices of these cryptocurrencies during the quarter varied by more than 3 times. For example, Ethereum’s High/Low index was 513.43/170.26=3.02 (see Table 1.2).
Table 1.2. Price changes in top 10 cryptocurrencies by capitalization during the period from July 1-October 1, 2018
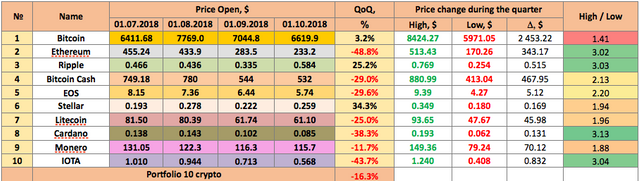
Thus, during the third quarter of 2018 the price change of the leading cryptocurrencies by capitalization ranged from -48.8% (Ethereum) to +34.3% (Stellar) compared to the start of the quarter (Fig. 2). The average yield of a portfolio consisting of equal shares of the cryptocurrencies in the top 10 (Portfolio 10 crypto) was negative, and equaled -16.3%. Overall, cryptocurrency market capitalization fell in the third quarter from $257.7 billion to $223.3 billion, i.e. by 13.3%.
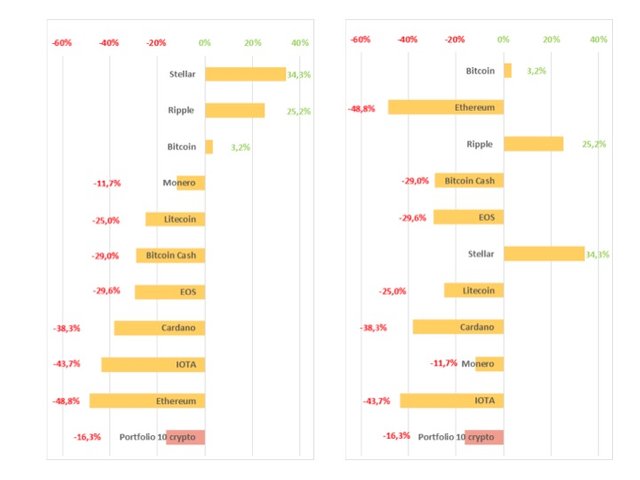

Figure 2. Price change in top 10 cryptocurrencies by capitalization during Q3 2018 (not including Tether), %
During the third quarter of 2018 the price of seven of the ten cryptocurrencies depreciated, with Ripple, Stellar, and Bitcoin being among the leaders in price growth. In July the fall was not as precipitous, and ranged from 1.4% for Litecoin to 11.6% for Tron. EOS and Tron showed the worst indicators. Tron continued its downward adjustment, which started after the jump in its price in late April, and the drop in EOS can be tied to the fact that vulnerabilities were found in the main network’s code. Bitcoin and Stellar had the biggest breakthroughs in July. On July 24 the price of the first cryptocurrency first passed the psychological barrier of $7,800, and then $8,000, thereby strengthening the positions achieved over the previous week. However, the bitcoin price subsequently dropped below $8,000 against the backdrop of the SEC’s repeat refusal to issue the Winklevoss brother’s bitcoin ETF (https://www.coinspeaker.com/2018/07/27/bitcoin-slips-below-8000-as-sec-rejects-bitcoin-etf-proposal-from-winklevoss-twins/).
The main news items for Stellar in this quarter were rumors on its possible listing on Coinbase, as well as its partnership with the IT giant IBM, which selected the platform for the creation of its cryptocurrency (https://www.forbes.com/sites/panosmourdoukoutas/2018/07/21/bitcoin-and-stellar-get-a-big-boost-from-ibms-stable-coin/#334321351843). Stellar was also the first cryptocurrency approved by Sharia law, which might have triggered a jump in demand among the Islamic community (https://cointelegraph.com/news/stellar-becomes-first-sharia-certified-blockchain-for-payments-and-asset-tokenization).
Ripple, which was founded by the same company as Stellar, was not far behind, showing the second best result among the top 10 with a 25% growth during Q3 2018. In September Ripple’s capitalization even passed that of Ethereum for a short time (September 21) on the strength of numerous favorable news stories and events. The best news for the Ripple price was the announcement that the commercial version of the xRapid platform from Ripple would be launched “in the next month or so” (October) (https://cointelegraph.com/news/ripple-could-launch-xrapid-solution-in-the-next-month-or-so-says-exec).
August was the worst month for the crypto markets in the third quarter, as their total capitalization plunged by 17.7% over the month. This can be attributed largely to the bad news that impacted bitcoin, which dragged the prices of most altcoins down with it. At the same time, bitcoin dominance increased during August from 48% to 53%, which shows the higher sensitivity of altcoins to bad news, and the switch of backers from altcoins to the more stable bitcoin during an adverse market trend. The key unfavorable news item influencing market capitalization was the decision of the SEC to postpone the decision on the VanEck and SolidX bitcoin ETF until the autumn (https://www.coindesk.com/sec-delays-vaneck-solidx-bitcoin-etf-decision-to-september/). From August 7-14 there was a sharp fall in the entire market, and in particular among altcoins. The Chinese authorities also continued to ramp up measures in their fight with cryptocurrencies, the Chinese search engine Baidu introduced censorship on the discussion of cryptocurrencies (https://stocksgazette.com/2018/08/28/chinese-search-giant-baidu-has-officially-began-censoring-cryptocurrencies/), and the blocking of access to foreign cryptoexchanges began (https://www.coinspeaker.com/2018/08/23/124-foreign-crypto-exchanges-to-be-forced-out-of-the-country-by-chinese-authorities/). However, after August 24 a positive trend and stabilization were seen. This turning point was reached after the SEC announced the possible reconsideration of its decision on bitcoin ETFs (https://www.coinspeaker.com/2018/08/24/sec-to-reconsider-the-latest-rejection-of-bitcoin-etf-from-proshares-graniteshares-and-direxion/).
The movement of the Monero price should be noted separately. This cryptocurrency lost the least of the seven depreciating cryptocurrencies from the top 10 by capitalization during the third quarter of 2018. From the chart it can be seen that although the price of this cryptocurrency consistently moved in tandem with market trends, over the last days of August it showed rapid growth that managed to level out all the losses incurred earlier, leaving its price practically unchanged during August while most cryptocurrencies dropped by around 20%. This can be attributed to a very positive report from the analytical company Satis Group, which mentions possible growth in the Monero price by more than 1,000% over the year (https://www.ccn.com/monero-headed-to-18k-ripple-price-primed-for-97-crash-research/).
It is also impossible not to comment on the largest drop among the top 10 cryptocurrencies, which happened to the second largest cryptocurrency by capitalization, Ethereum. During August and September its price fell from $433 to $233, i.e. by $200, and even briefly found itself at $170 (September 12). The exceptional depreciation of Ethereum can be tied to its mass sale by completed ICO projects (https://www.trustnodes.com/2018/08/11/icos-sold-nearly-100000-eth-past-30-days). During a fall in the crypto market, most funds collected via ICO in Ethereum are immediately sold to finance and develop the startups. Research data was published in support of this theory: ICO projects sold 300,000 ETH in a month (https://ethereumworldnews.com/ethereum-might-not-have-bottomed-out-yet-ico-sell-off-is-the-culprit/). The news that the reward for a block of Ethereum may be lowered in October from 3 ETH to 2 ETH also contributed to the uncertainty of the Ethereum price (https://coinjournal.net/ethereums-constantinople-hard-fork-to-ropsten-testnet-in-october-no-date-for-mainnet-yet/), as did the sharp increases in transaction fees (see below). The news on the forthcoming Constantinople hard fork in the Ethereum network had a somewhat positive effect on the price, and in the second half of September (September 12-30, 2018) a growth from $170 to $233 was seen (https://coingape.com/unlocking-the-ethereum-bull-code/). Constantinople is the second part of the two-phase Metropolis hard fork on the Ethereum network. However, in total Ethereum lost around 45% of its price during the third quarter of 2018, and even the favorable news that Vitalik Buterin had proposed scaling Ethereum using zk-snarks technology (https://www.coindesk.com/500-transactions-a-second-vitalik-says-zk-snarks-could-scale-ethereum/) did not help the price. You will recall that the solution involving the use of zk-snarks could resolve the network’s existing problems and increase the number of transactions to 500 per second without the need to resort to second level solutions such as Plasma or Raiden.
Calculation of the trading activity index on cryptoexchanges
To analyze trading activity on cryptocurrency exchanges, the ZAK-n Crypto index is calculated (see the Glossary). The 24-hour trading volumes (Adjusted Volume 24h, taking into account trading volumes excluding markets with no fees and transaction mining) for the four and eight dominant cryptocurrencies during the third quarter were approximately 2-2.5 lower than at the start of the year (Table 1.1), which attests to a fall in activity on cryptoexchanges.
The values of the ZAK-4 Crypto indexes are shown in Tables 1.1, 1.3. In July-September the 24-hour trading volume (Adjusted Volume 24h) of the four dominant cryptocurrencies (Bitcoin, Ethereum, Bitcoin Cash, Ripple) averaged from $6 to $9 billion (Table 1.3). However, 24-hour trading volume of up to $14 billion was seen on September 21. The daily ZAK-4 Crypto index equaled 3-4% of capitalization on average, but during certain periods (for example, September 20-21 on the back of growth in the Dow Jones Industrial Average, which managed to reach a new record high two days in a row) it exceeded 8%.
As of October 1, the 24-hour trading volume of the four dominant cryptocurrencies equaled $7.5 billion, i.e. 4.4% of their market capitalization (Table 1.3).
Table 1.3. Daily ZAK-4 Crypto index calculation (from July 1-October 1, 2018)
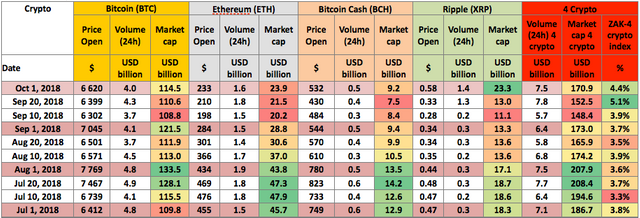
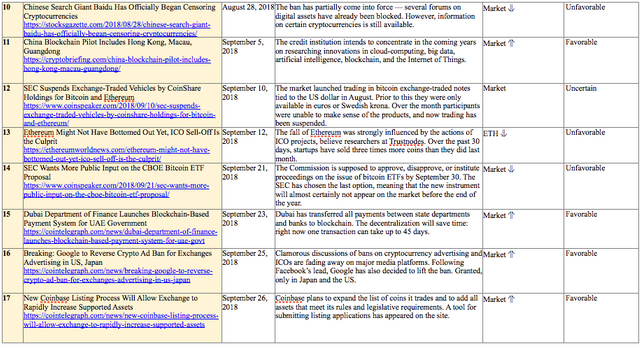
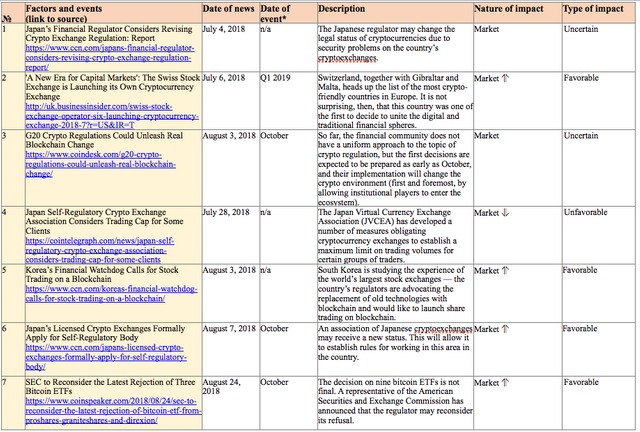
Table 1.4 shows the main events that took place in the third quarter of 2018 that had an impact on both the prices of the dominant cryptocurrencies and the market in general, with an indication of their nature and type of impact.
Table 1.4. Key events of the week having an influence on cryptocurrency prices, July-September 2018
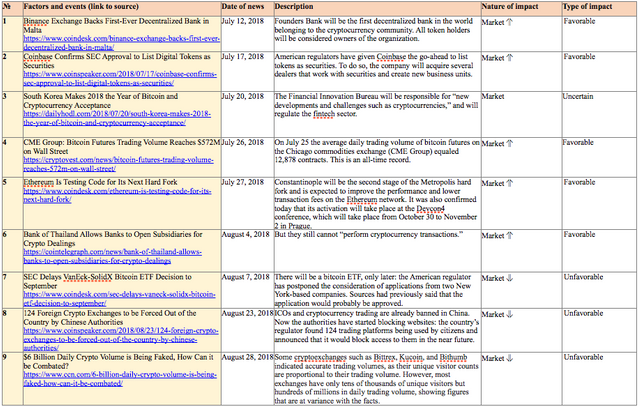
For the most part, the events of July had a positive impact on the cryptocurrency market, leading to its growth from $257.7 billion to $277.8 billion, i.e. by $20 billion. The events in August and September, on the other hand, led to a contraction of the cryptocurrency market by approximately $50 billion and $5 billion, respectively.
The trend toward a change in transaction fees since the start of Q3 2018 for Bitcoin, Ethereum, Ripple (XRP), Bitcoin Cash, and Litecoin is given in Figure 3.
The average transaction fee for bitcoin has stabilized since July 1 at the level of $0.43-$1.33 (see Fig. 3). We remind you that prior to the implementation of the network scaling solutions (Segregated Witness and Lightning Network), the transaction fees had reached $55 in December 2017. This reduction is due to the fall in the number of transaction in the network (Fig. 4) and the gradual introduction of SegWit and Lightning.
As can be seen from Figure 3, in July and August the average amount of fees in the Ethereum network was several times higher than the fees in the Bitcoin network. On July 2 they reached $5.5, but by early September they had already fallen to $0.16-$0.3. In particular, according to the version of btcmanager, two events were responsible for the growth in fees in the Ethereum network on July 16: the airdrops on the recently created Chinese exchange FCoin and EOS bots “spamming” the Ethereum network. The bots created a fake ERC20 token called iFish, which initiated thousands of additional empty transactions with the iFish smart contract. The daily expense of fuel to finance the bot accounts exceeded 50 ETH.
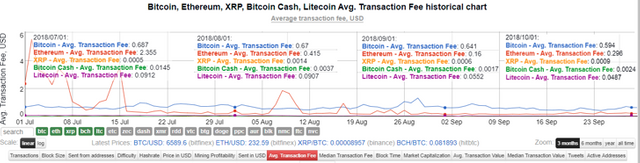
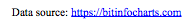
Figure 3. Average Bitcoin, Ethereum, Ripple (XRP), Bitcoin Cash, and Litecoin transaction fees
The number of transactions in the bitcoin network has dropped by approximately 2-2.5 times since December 2017, i.e. approximately the same as its value. That being said, starting in March 2018 a clear weekly cycle in the number of transactions with lower/upper limits of around 150,000/250,000 per day can be seen from Figure 4. On the weekends the number of transactions falls (minimum), and it increases by mid-week. Similar data on the number of confirmed daily bitcoin transactions can be found at https://www.blockchain.com/ru/charts/n-transactions.
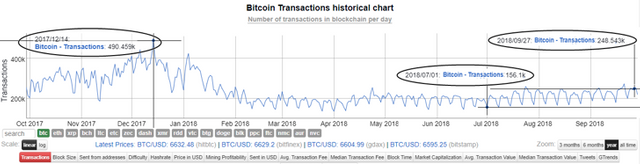
Figure 4. Number of Bitcoin transactions
According to information from sifrdata.com (Fig. 3), over the past three months a fairly close correlation has been seen between the indicators of the leaders on the cryptocurrency market - Bitcoin, Ethereum, Bitcoin Cash, Stellar, Litecoin, Monero, Dash, Ethereum Classic, NEM, Zcash, and other cryptocurrencies (highlighted red band).

Figure 5. Correlation between cryptocurrencies
It is assumed that the closer the correlation matrix is to 1, the closer the correlation between the price change trends of cryptocurrencies. If the ratio is close to zero, there is no correlation between the indicators. If the ratio is close to -1, the ratio is inverse.
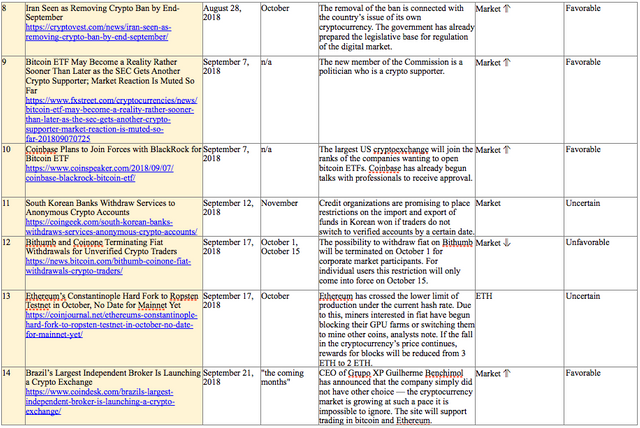
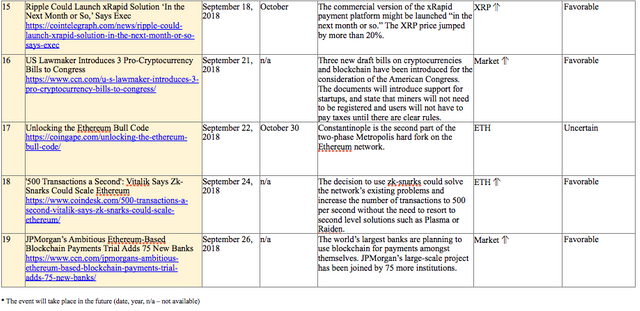
Table 1.5 gives a list of events, information on which appeared last week, which could impact both the prices of specific cryptocurrencies and the market in general.
Table 1.5. Events that could have an influence on cryptocurrency prices in the future
1.2. Market trends
The weekly cryptocurrency and digital asset market trends from December 31, 2017, to September 30, 2018, are presented as graphs (Fig. 1.1-1.5).
Table 1.6. Legends and descriptions of the graphs
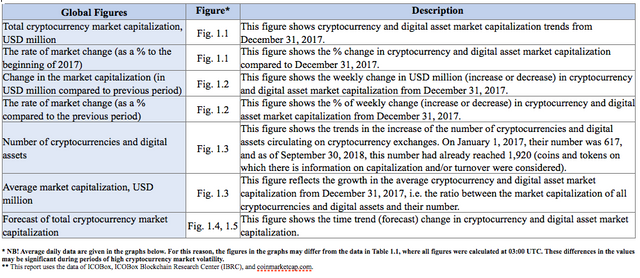
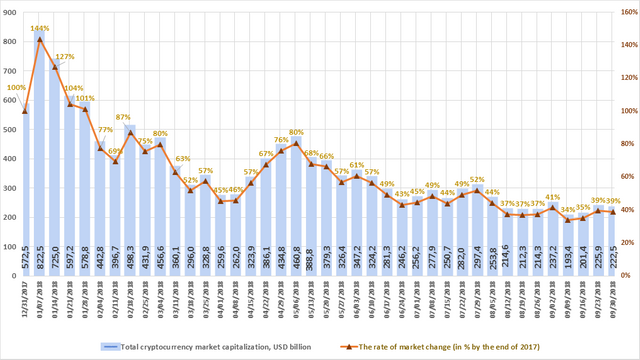

Figure 1.1. Total cryptocurrency market capitalization (weekly trend)
Figure 1.1 shows a graph of the weekly cryptocurrency market change from December 31, 2017, to September 30, 2018. Over this period, market capitalization dropped from $572.5 billion to $222.5 billion, i.e. by 61%. Last week (September 23-30, 2018) cryptocurrency market capitalization changed slightly from $225.9 billion to $222.5 billion (as of September 30, 2018, based on the average daily figures from coinmarketcap.com).
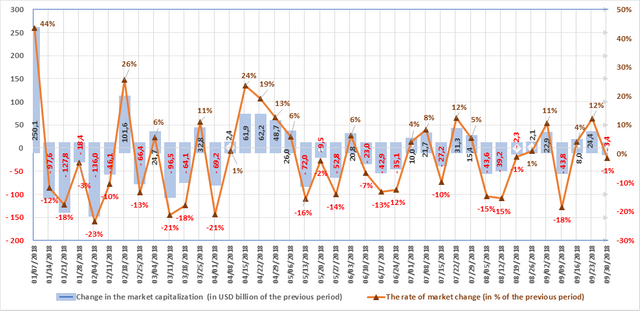
Figure 1.2. Change in market capitalization (weekly trend)
The market is susceptible to sudden and drastic fluctuations. Nine of the thirteen weeks in the first quarter of 2018 were “in the red,” i.e. capitalization fell based on the results of each of these weeks, and the weekly fluctuations ranged from USD -136 billion to USD +250 billion.
Six of the thirteen weeks in the second quarter were “in the red.” The market grew based on the results of the other seven weeks. As noted earlier, a growth was seen in April, while in May and June there was generally a reduction in capitalization. The weekly fluctuations ranged from USD -72 billion to USD +62.2 billion.
In the third quarter seven of the 13 weeks have seen an increase in capitalization, and six a decrease (with due account of average daily data of coinmarketcap.com, see Fig. 1.2). In July there was an increase of $20 billion, but August saw a decrease of $49 billion. On the whole, since the start of September capitalization has fallen by approximately $6 billion.
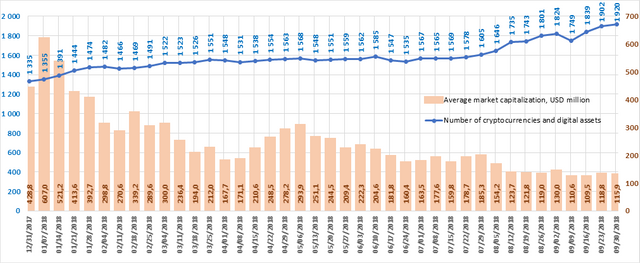

Figure 1.3. Number of cryptocurrencies and digital assets (weekly trend)
Since December 31, 2017, the total number of cryptocurrencies and digital assets presented on coinmarketcap has increased from 1,335 to 2,017. However, when calculating cryptocurrency market capitalization only those coins and tokens on which there is information on trades (trading volume) are taken into consideration. Over the past week their number increased from 1,902 to 1,920, while average capitalization fell to $115.9 million. In total, over the past month 112 new coins and tokens have appeared on coinmarketcap.com. However, it should be noted that a number of other coins and tokens were also excluded from the list. Among the tokens that were added to coinmarketcap.com last week, ZB and Paxos Standard Token showed high trading volumes.

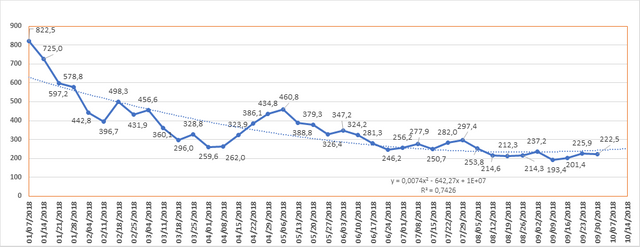
Figures 1.4 and 1.5. Forecast of total cryptocurrency market capitalization
The influence of major institutional players on the market increased, as did the impact of state regulatory processes. However, the effect of these factors is not always clear cut, and at present it is largely negative. Hacker attacks also continue to have an adverse impact on the cryptocurrency market. Over the first nine months capitalization has fallen by 64%. All these factors increase risks and lower the appeal of the cryptocurrency market, but, at the same time, billions of dollars have already been invested in blockchain. The market is experiencing a lull related to the gradual change in trends and the creation of infrastructure and launch sites for the arrival of major institutional backers. Competition is becoming more serious and global, and the quality requirements on projects are increasing along with their ability to effectively use internal resources and to cut organizational expenses.
Quarterly ICO Market Analysis (Q3 2018)
1. General analysis of the ICO market (during the third quarter)
1.1. Brief overview of ICO market trends
1. General analysis of the ICO market (during the third quarter)
1.1. Brief overview of ICO market trends
The third quarter of 2018 was not as successful for ICOs as the first and second quarters. Nevertheless, the total amount of funds collected exceeded $2.4 billion. In this regard, the 20 largest ICOs accounted for more than 40% of this amount (around $1 billion) (Table 1.4).
More than 600 ICOs were completed during Q3 2018. The website https://icobench.com alone shows 525 completed projects for the period from July 1-September 30. This same website also shows more than 240 projects that are scheduled to start after October 1, 2018.
Despite the high risk of placing funds in ICOs, the statements of many publications on the existence of numerous fraudulent projects, and the depreciation in the prices of the tokens of many projects, this area continues to develop in anticipation of positive changes on the cryptocurrency market. Some ICOs issuing new tokens are in fact concealed offers of securities, which could be dangerous for backers. Due to the absence of clear legislative and regulatory principles on ICOs in most countries, ICO participants encounter new difficulties and possibilities.
Yet, nevertheless, the third quarter was rich in interesting events (Table 1.1) and large ICOs (Table 1.4). For example, the leader by funds collected in the third quarter was the tZERO project, which is a subsidiary of the Blockstain Overstock.com company. According to the information from a Forbes publication dated August 9, tZERO collected $134 million. The project was launched on December 18, 2017, and was developed to meet SEC requirements. tZERO is the first alternative trading system for cryptographic tokens that the US Securities and Exchange Commission (SEC) assigns to the category of securities. The goal was to collect $250 million. However, according to information from the press release, the funds collected by tZERO equaled $134 million. GSR Capital will subsequently purchase a share in the project worth $270 million when the company’s capitalization reaches $1.5 billion.
Table 1.1. Brief ICO market overview, key events and news for Q3 2018
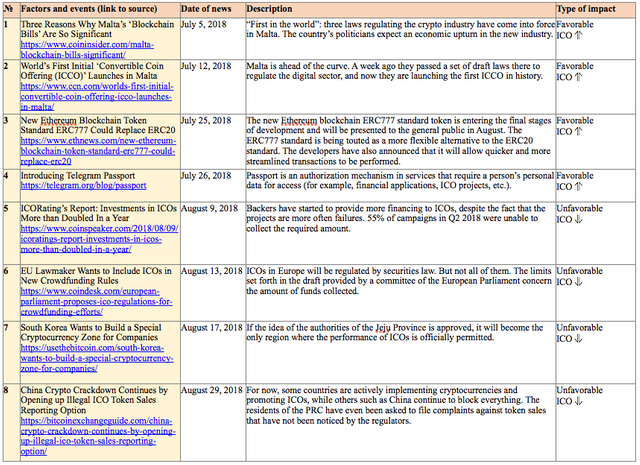
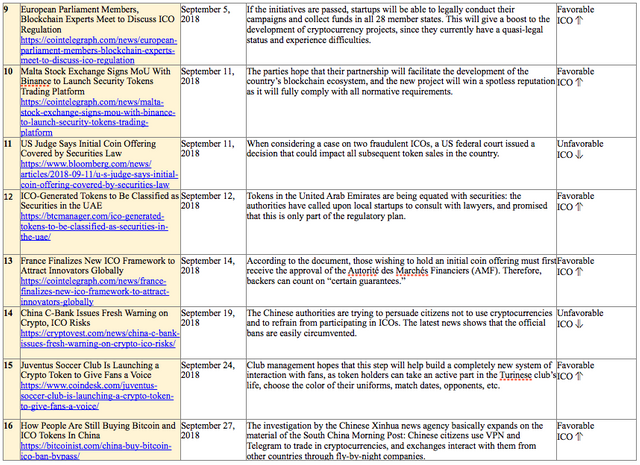
Table 1.2 shows the development trends on the ICO market since 2017. Only popular and/or successfully completed ICOs (i.e. ICOs which managed to collect the minimum declared amount of funds) and/or ICOs listed on exchanges were considered.
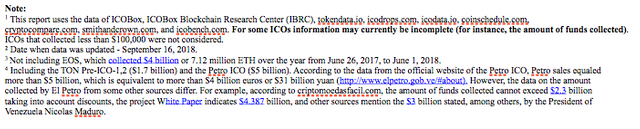
Table 1.2. Aggregated trends and performance indicators of past (completed) ICOs1,2,3,4
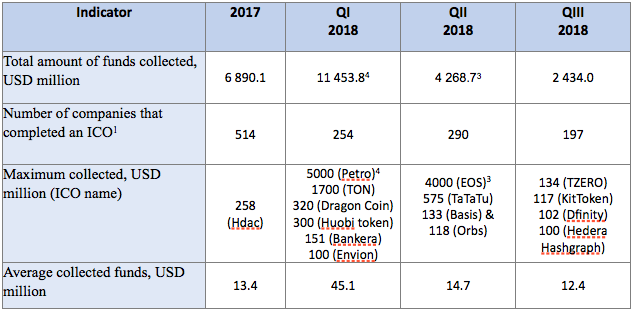
The data for the previous period were adjusted to account for the appearance of more complete information on past ICOs. The amount of funds collected via ICOs during the past quarter (July-September) equaled $2.4 billion. This amount consists of the results of 518 successfully completed ICOs, with the largest amount of funds collected equaling $134 million (tZERO ICO). The average amount of funds collected per project equaled $4.7 million (see Tables 1.2, 1.3). Overall, more than 150 ICOs were completed last month, but information on the amount of funds collected is not available for all of them.
Table 1.3. Amount of funds collected and number of ICOs
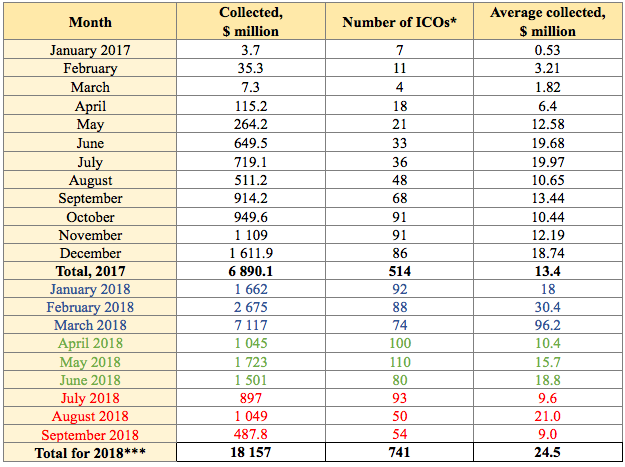
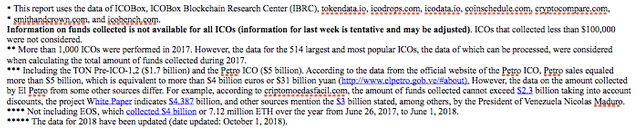
Table 1.3 shows that the largest amount of funds was collected via ICOs in February-March 2018, mainly due to the appearance of major ICOs. The highest average collected funds per ICO was also seen in February-March 2018.
In total, more than $18 billion were collected via ICOs in the first three quarters of 2018 (and that is without the funds of EOS, an ICO that lasted for an entire year). This amount was collected by a total of only 741 projects.
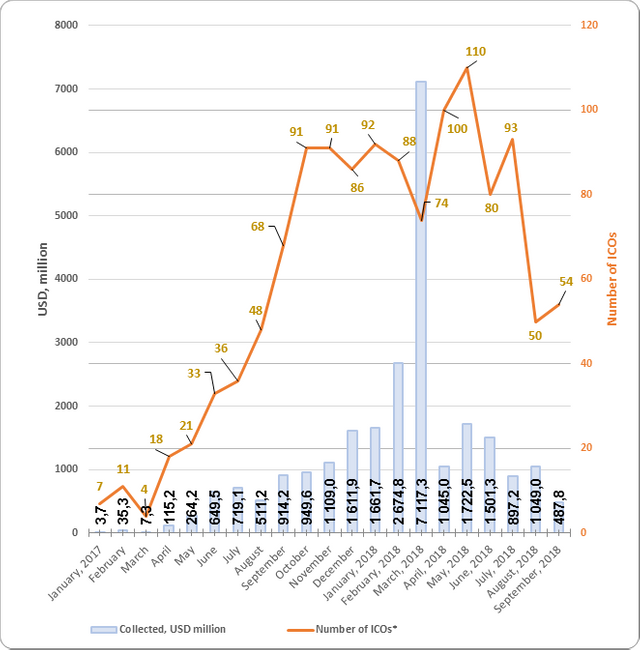
Figure 1.1. Trends in funds collected and number of ICOs since the start of 2017
1.2 Top ICOs during Q3 2018
Table 1.4. Top 20 ICOs by the amount of funds collected during Q3 2018
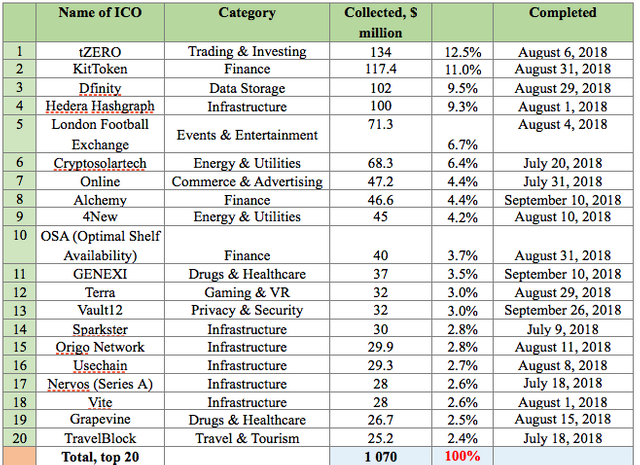
Table 1.4 shows the top 20 largest ICOs by funds collected, most of which belong to the categories Infrastructure, Finance, and Trading & Investing.
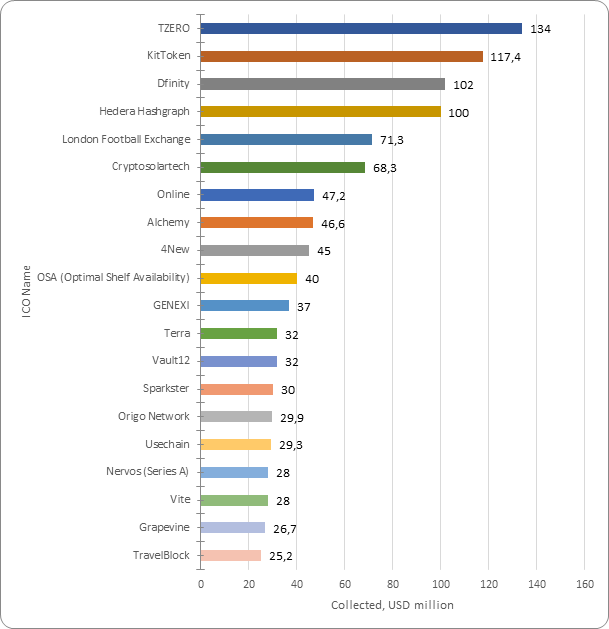
Figure 1.2. Top 20 ICOs by the amount of funds collected during Q3 2018
During the third quarter of 2018 more than $2.4 billion were collected (this amount includes 197 ICOs). However, due to the fall in total capitalization of the cryptocurrency market since the start of 2018, the adjustment has crossed over to ICOs as well. This is leading to a steady fall in the hard cap requirements of projects, a drop in the effectiveness of fund collection, and many projects are not disclosing data on the amount of funds collected on their official websites. The future effectiveness of ICOs will depend directly on the change in cryptocurrency market capitalization, as well as on the formation of legislative norms for holding ICOs in the countries of the European Union, the USA, Japan, South Korea, UAE, and, of course, China.
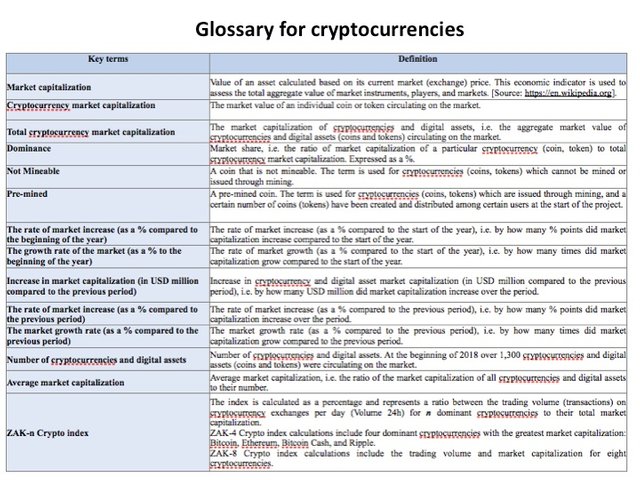
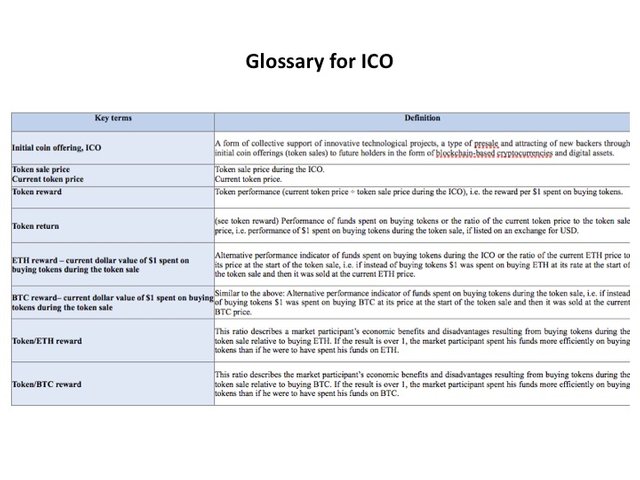
The Glossary is given in the Annex.
Annex
Glossary
You got a free upvote from @reversed-bidbot! Follow me to earn steem by interacting with my promoted posts.