Learning Trade Coin: Using Candlestick Chart In Trade Coin (Part 1)
Technical analysis is the way to investors can judge market trend in the future. Through the price chart, investors will analyze the market psychology, trends.... thereof they can make the right investment decision.
In trading, three main types of chart is often being used:
- Line chart.
- Bar chart.
- Candlestick chart.
Each of these chart has its own advantages/disadvantages. However, The most popular is Candlestick Chart that are being used in stock, forex and crypto market.
- There are Two Basic Candlesticks:
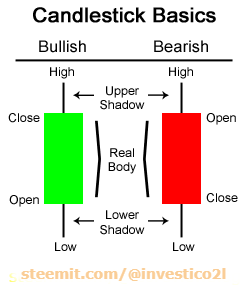
- Bullish Candle: When the close price is higher than the open price. (It’s usually green or white).
- Bearish Candle: When the close price is lower than the open price (It’s usually red or black). A candlestick is constituted by three part:
- Upper Shadow: The vertical line between the high of the day and the close (bullish candle) or open (bearish candle)
- Real Body: The difference between the open and close; colored portion of the candlestick
- Lower Shadow: The vertical line between the low of the day and the open (bullish candle) or close (bearish candle)
- Some Basic Candlestick Patterns:
- Spinning Tops Candlestick:
Spinning tops candlestick have small real body, a long upper shadow and long lower shadow. The color of the real body is not important.

Spinning tops pattern indicates the indecision between the buyers and sellers.Neither buyers nor sellers could gain the upper hand, and the result was a standoff.
+ If a spinning top forms during an uptrend, this usually means there aren’t many buyers left and a possible reversal in direction could occur.
+ If a spinning top forms during a downtrend, this usually means there aren’t many sellers left and a possible reversal in direction could occur.
- Marubozu Candlestick:
Marubozu means there are no shadows from the bodies.

A Green Marubozu contains a long white body with no shadows. The open price equals the low price and the close price equals the high price. This is a very bullish candle as it shows that buyers were in control the entire session. It usually becomes the first part of a bullish continuation or a bullish reversal pattern.
A Red Marubozu contains a long black body with no shadows. The open equals the high and the close equals the low. This is a very bearish candle as it shows that sellers controlled the price action the entire session. It usually implies bearish continuation or bearish reversal.
Doji Candlestick:
Doji candlesticks have the same open and close price or at least their bodies are extremely short. A doji should have a very small body that appears as a thin line.
There are THREE types of Doji candlesticks:
- Dragonfly Doji:
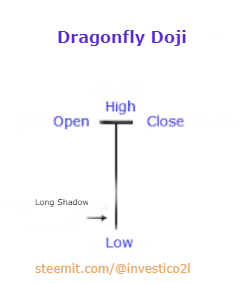
Dragonfly Doji is typically interpreted as a bullish reversal candlestick pattern that mainly occurs at the bottom of downtrends. The Dragonfly Doji is created when the open, high, and close are the same or about the same price (Where the open, high, and close are exactly the same price is quite rare). The most important part of the Dragonfly Doji is the long lower shadow.
- Long-Legged Doji:
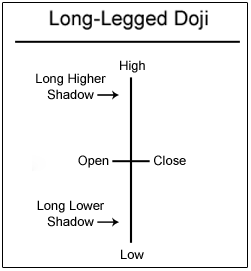
Long-legged Doji is a candle with long upper and lower shadows and a small real body. The pattern shows that there is an indecision between the buyers and the sellers, and that the market is approaching transition period.
Bullish Long Legged Doji has very long shadows on both the ends. The patterns shows indecision of buyers and sellers. It is a bullish reversal pattern. In this pattern, market is in a bearish mood and is in downtrend. Then, a Long Legged Doji appears, which gaps in the current trend.
Bearish Long Legged Doji has very long shadows on both the ends. The pattern shows indecision of buyers and sellers. It is a bearish reversal pattern. In this, market is in a bullish mood and is in uptrend. Then, a Long Logged Doji appears, which gaps in the current trend.
- Gravestone Doji:
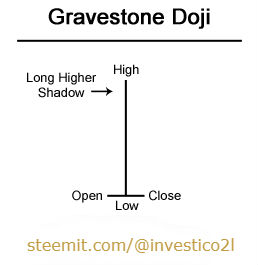
A gravestone doji is a bearish reversal candlestick pattern that is formed when the open, low, and closing prices are all near each other with a long upper shadow. The long upper shadow suggests that the bullish advance in the beginning of the session was overcome by bears by the end of the session, which often comes just before a longer term bearish downtrend.
Thanks for basic knowledge.
Congratulations @investico2l! You have completed some achievement on Steemit and have been rewarded with new badge(s) :
Click on any badge to view your own Board of Honor on SteemitBoard.
For more information about SteemitBoard, click here
If you no longer want to receive notifications, reply to this comment with the word
STOP