Moving Averages (SMA, EMA): How to use and calculate them (spreadsheet and code included)
This is the first in a series of posts about trading indicators, in which I talk about indicators that can be used to trade crypto (or anything else, actually) and offer a spreadsheet and code snippets to calculate them. Read more about the series at the bottom of this post.
.png)
Shortcuts for the lazy:
- Spreadsheet with examples on how to calculate SMA and EMA.
- Python script
ma.pyto calculate the SMA and EMA. - Input file for
ma.py.
Intro
Moving Averages (MAs) are among the simplest indicators used for trading, which doesn't mean they are not powerful. In short, they are the average prices for a given period. They smooth the price and point the current trend.
MAs come in several flavors: Simple Moving Averages (SMA), Exponential Moving Averages (EMA), Double Exponential Moving Averages (DEMA), Smoothed Simple Moving Averages (SSMA), and others. They differ mostly in how fast they respond to price action: some respond very fast and others slowly, averaging more. Other way to look at how they differ from each other is to think of weights: SMA gives the same weight to all candles in the period; EMA gives more weight to recent candles; DEMA gives even more (double) weight to recent candles.
Like many other indicators, they are old and have been extensively used by traders to trade all kinds of assets, and can also be used for crypto.
Main features and how to use MAs
- As the name says, these indicators are averages of the prices over a set period of time (in other words, a given number of candles). They help filter noise and small unimportant changes.
- They are lagging indicators, they represent historical data. Exponential moving averages (EMA) have less lag, they respond to the current prices faster than simple averages.
- The price used to calculate the MA is usually the closing price, but it can be any other. You can even have the MA of a MA!
- MAs are possibly the most used indicators since several other indicators use them as a base for their calculations.
- They can be applied to any time frame. When applied to bigger time frames (e.g. daily or monthly) they have bigger significance than when applied to smaller time frames (e.g. 5 minutes), as is the case for most indicators.
- MAs can be used in pairs to detect crosses, usually representing trend changes. For example, some people use the EMA(8) and EMA(20) to detect local trend changes. The crossing point of these MAs can also be used as a support or resistance line.
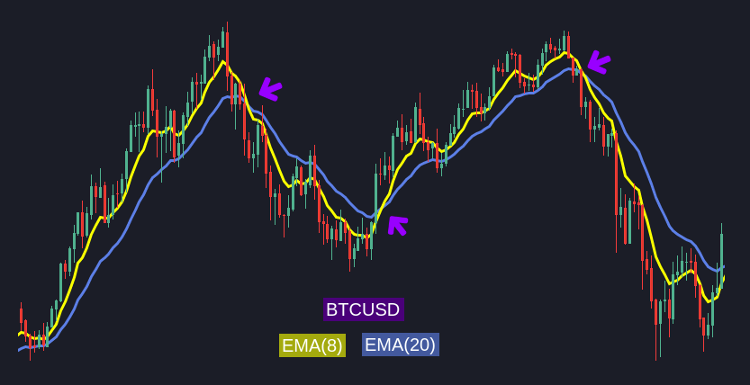
EMA crosses on BTCUSD.
- Currently famous MAs are the SMA(50) and the SMA(200), that have been extensively talked about since bitcoin’s "death cross".
- There is no right time frame for MAs, so use the time frames most people use. The SMA(50) and SMA(200) are generating the so-called death cross only because people are looking at them. If you find a cross between SMA(32) and SMA(3) it will probably not mean anything .
- Open Close Cross Strategy (OCC) is a trading strategy that uses the MA of both the open and the close price, triggering buys and sells when these MAs cross.
- MAs can be good to find support and resistance lines. During bitcoin's bull run between November and December of 2017, the price dropped down three times, hitting the SMA(50) before going straight back up. After it broke the SMA(50) and started the bear trend, the SMA(50) line became a resistance.
- MAs also indicate the current trend. In that same period on bitcoin, you can see that the SMA is pointing up during the entire bull run and starts pointing down after the reversal. The longer the time frame used, the longer it will take for the MA to reverse, so that's why the SMA(50) took quite a few days to start pointing down after bitcoin started a bear trend.
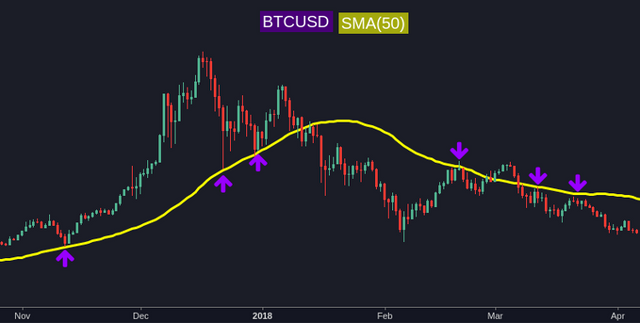
SMA(50) acting as support and resistance on BTCUSD.
How to calculate
In this post I'll focus on SMA and EMA, leaving EMA(EMA) and DEMA for a future post.
Spreadsheet
The best way to learn is to check an example of how it's done. Check the SPREADSHEET showing how this indicator is calculated with real examples.
SMA
The SMA is a simple average with a simple formula  :
:
SUM(price) / length
So let's say the close price for the previous 5 candles are: 10, 11, 12, 13, 14
The SMA(5) for the latest candle (that closed at 14) is: (10 + 11 + 12 + 13 + 14) / 5 = 12
EMA
The EMA is slightly more complicated. The first EMA is exactly the same as the SMA:
Initial EMA: SUM(price) / length
For all others, calculate a multiplier with:
Multiplier: (2 / (length + 1))
And than the EMA with:
EMA: (price - EMA(previous)) * multiplier + EMA(previous)
In the formulas, length is the length of the EMA (e.g. for EMA(5), use 5) and EMA(previous) is the EMA of the previous candle.
Show me the code
The code is built using python 3. It reads the candles from the file input.csv that you can download here.
You can change the parameters at the top of the file, that by default will calculate the SMA(5) and EMA(5) of the candles in the input file using the closing price of the candles. Edit the file accordingly, save it as ma.py and simply run it with python3 ma.py
You can then double check the results with the values in the spreadsheet to confirm everything is correct!
import csv
import re
from functools import reduce
from dateutil import parser

CSV_FILE = 'input.csv'
EMA_LENGTH = 5
EMA_SOURCE = 'close'

candles = []

# Reads the input file and saves to `candles` all the candles found. Each candle is
# a dict with the timestamp and the OHLC values.
def read_candles():
    with open(CSV_FILE, 'r') as csvfile:
        reader = csv.reader(csvfile, delimiter=',')
        for row in reader:
            try:
                candles.append({
                    'ts': parser.parse(row[0]),
                    'low': float(re.sub(",", "", row[1])),
                    'high': float(re.sub(",", "", row[2])),
                    'open': float(re.sub(",", "", row[3])),
                    'close': float(re.sub(",", "", row[4]))
                })
            except:
                print('Error parsing {}'.format(row))

# Calculates the SMA of an array of candles using the `source` price.
def calculate_sma(candles, source):
    length = len(candles)
    sum = reduce((lambda last, x: { source: last[source] + x[source] }), candles)
    sma = sum[source] / length
    return sma

# Calculates the EMA of an array of candles using the `source` price.
def calculate_ema(candles, source):
    length = len(candles)
    target = candles[0]
    previous = candles[1]

    # if there is no previous EMA calculated, then EMA=SMA
    if 'ema' not in previous or previous['ema'] == None:
        return calculate_sma(candles, source)

    else:
        # multiplier: (2 / (length + 1))
        # EMA: (close - EMA(previous)) x multiplier + EMA(previous)
        multiplier = 2 / (length + 1)
        ema =  ((target[source] - previous['ema']) * multiplier) + previous['ema']

        return ema

def calculate(candles, source):
    sma = calculate_sma(candles, source)
    ema = calculate_ema(candles, source)
    candles[0]['sma'] = sma
    candles[0]['ema'] = ema

if __name__ == '__main__':
    read_candles()

    # progress through the array of candles to calculate the indicators for each
    # block of candles
    position = 0
    while position + EMA_LENGTH <= len(candles):
        current_candles = candles[position:(position+EMA_LENGTH)]
        current_candles = list(reversed(current_candles))
        calculate(current_candles, EMA_SOURCE)
        position += 1

    for candle in candles:
        if 'sma' in candle:
            print('{}: sma={} ema={}'.format(candle['ts'], candle['sma'], candle['ema']))
References
- Moving averages at stockcharts.com
- Moving averages' set or articles on Investopedia.
- Bitcoin's death cross on Investopedia
About this series
This is one in a series of posts about trading indicators, in which I talk about indicators that can be used to trade crypto (or anything else, actually). You can already find extensive information about most of these indicators on the internet, but it isn't always easy to find reliable and detailed information on how to calculate them. So I focus on a very concise explanation of how they work and mostly on the formulas, including a spreadsheet and code snippets in all the posts so you can calculate the indicators yourself!
Some indicators are extremely simple to calculate (SMA is one of them), but some are kinda tricky. You might spend hours trying to adjust parameters and formulas to get them right. Or you can just get the code here and use it 
The code is usually done in python and validated against TradingView, a reliable source of price information and indicator values.
Stay tuned for the next posts in the series. Until then you can check my previous posts at:
Resteemed to over 17100 followers and 100% upvoted. Thank you for using my service!
Send 0.200 Steem or 0.200 Steem Dollars and the URL in the memo to use the bot.
Read here how the bot from Berlin works.
We are happy to be part of the APPICS bounty program.
APPICS is a new social community based on Steem.
The presale was sold in 26 minutes. The ICO is open now for 4 rounds in 4 weeks.
Read here more: https://steemit.com/steemit/@resteem.bot/what-is-appics
@resteem.bot