Bitcoin (BTC/USD): Evening Analysis, Next Target $9,500!

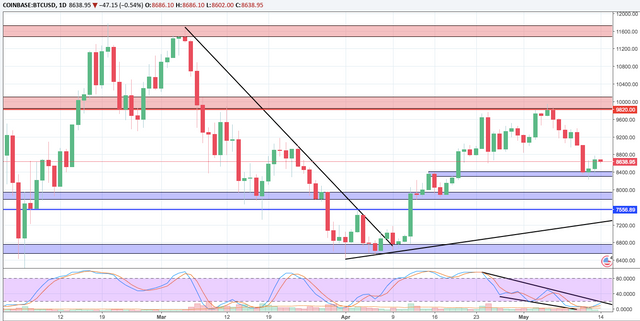
Daily
Looking at our trend timeframe we see price has bounced off $8,300 support zone. Switching over to our Stochastic RSI indicator we see momentum is stick in a descending wedge and is looking to break towards the upside. A daily close above $ 8,700 activates our trade.
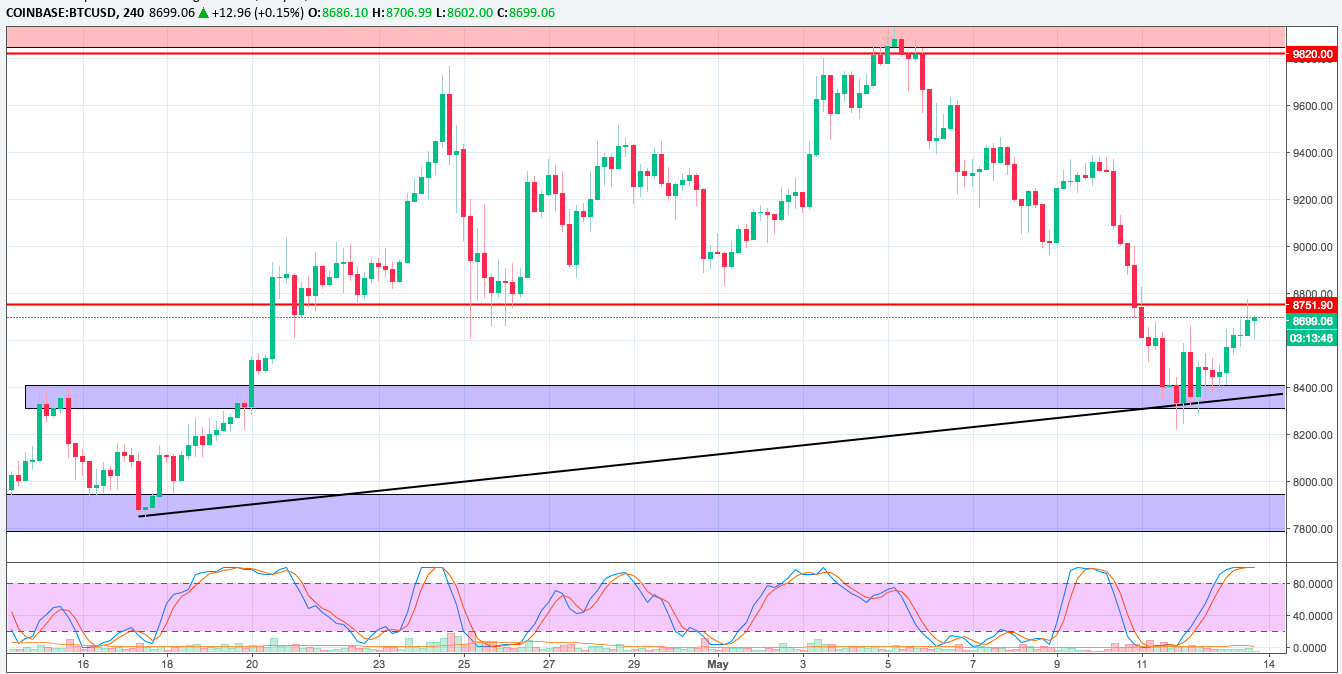
4Hour
Shifting over to our pattern timeframe we see price bouncing off dynamic and horizontal support. Expecting a 4hour close above $8,700 with a wick fill activates our trade, stochastic RSI showing momentum is bullish however it is currently slowing down.
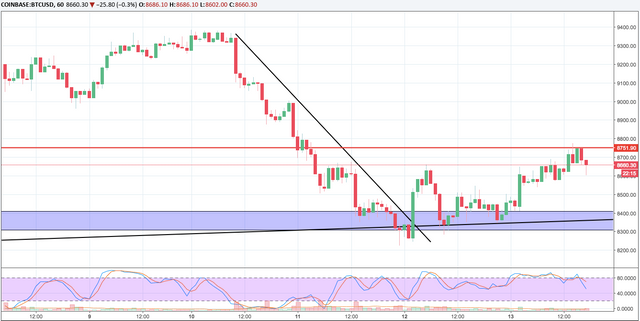
Hourly
Finally looking over at our trigger timeframe we see price has hit resistance @ $8,750. Price has formed a double bottom $8,350. An hourly close above $8,700, stochastic RSI showing momentum is bearish.
Conclusion
- Buy: After 4hour close above $8,700 activates our trade.
- Sell: NO

Comment Down below what coin you want me to do next! ;)
Thank You for Your Support, Upvote and Follow!!! New Blog and Video everyday
Social Media:
Twitter
Instagram
InvestFeed
Tradingview
Crypto Trading W/ Leverage
How to Draw Trend-lines & Identify Trends
How to Draw Support/Resistance, Price Only
Disclaimer: I am not a financial advisor nor am I giving financial advice. I am sharing my biased opinion based off speculation. You should not take my opinion as financial advice. You should always do your research before making any investment. You should also understand the risks of investing. This is all speculative based investing.