Trading Signals For Nexus ☢☡
NXS / BTC

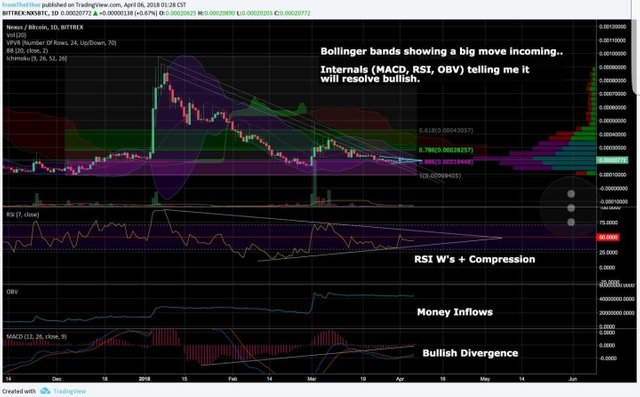
The technicals look great!
Price: Prime trade location, just above .
886 fibonacci level.
Price is consolidating, shown by the pennant and the bollinger bands.
We're going up or down from here; my hunch is we're about to breakout upwards due to the strong supporting internals.
Volume: OBV telling me it's being accumulated steadily.
The horizontal volume profile is telling me we've got a lot of business to do in the 45K+ sat range.
Vertical volume still looking minimal, expecting this to pick up once we resolve from this bollinger squeeze.
Momentum: RSI making new highs and stair-stepping its way up in a W-like fashion, just what we want.
MACD showing a clear bullish divergence which has been long and drawn out
- this is very promising.. also making new highs.
Buy it on: Bittrex
Entries:
20K sats
18K sats
Profit Objectives:
- Option 1) Sell 100% at 56K sats (+178%)
- Option 2) Sell half your position each time value doubles
Recommended Position Size:
1%-3% of your portfolio

Please
Remember to stay alert and never invest money that you can not lose.
Discover and be careful if I can afford. The gains are attractive but the losses can be more than devastating, so if we think it's wise to talk about it, let's try to do it intelligently and educatively without forgetting the risks.
Take Care All
Peace & Unity

Sources:cryptosignals
Giphy
Cryptobase
Wikimedia