Bitcoin/USD (BTC) Chart Analyst - Update
Two days ago I posted my analysis of Bitcoin and created a detailed overview of BTC activity. Today I've gone back and noticed a few things. Bitcoin hit the marker I labelled as 'Current Support,' which was also the Resistance we saw before the December price hike. BTC price has hit that support line and is looking to resume testing the waters within the area between current resistance and support.
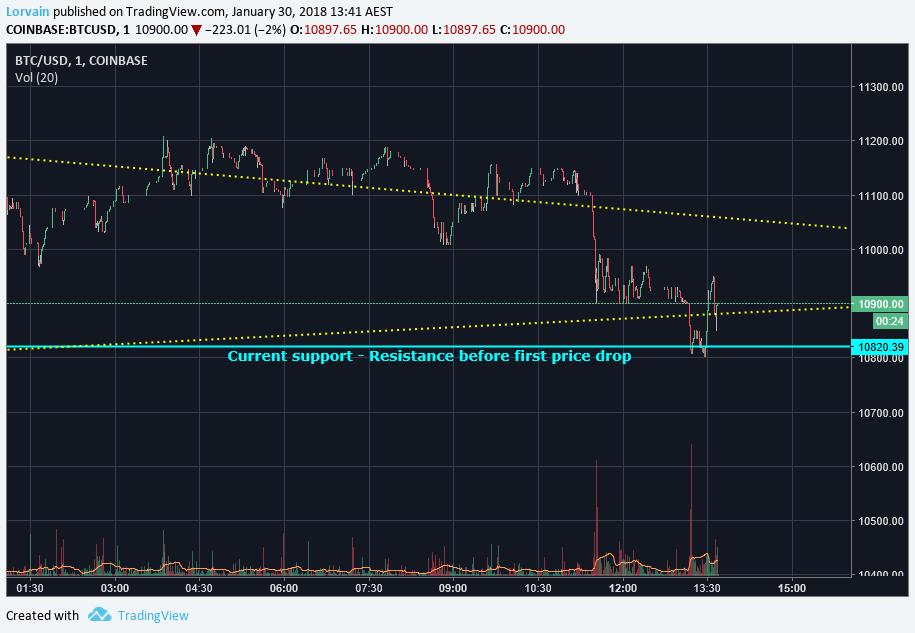
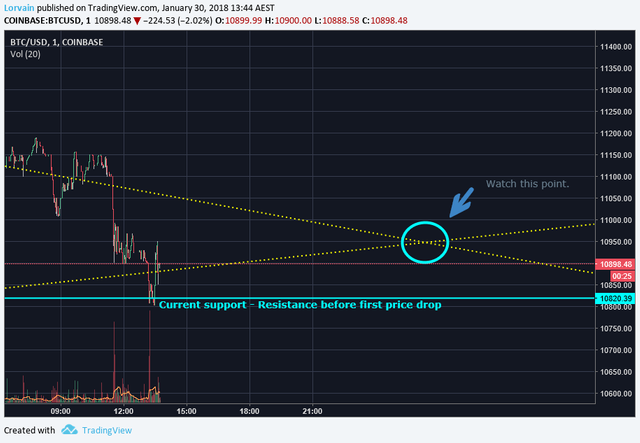
The yellow dotted lines indicate High and Low trends. They intersect at a certain point, which I believe to indicate a pretty clear direction BTC price will take. The next six or so hours will be critical and it's likely we will know the path from there.
What this means exactly: Above the cross intersection, Bullish market. Below the cross intersection, Bearish market.
Keep in mind that I am not an expert, nor claim to be. Take this information as you will and under no circumstances assume this is advice. This analysis is pure opinion, speculation, and freely given information.
On another note, I'll be doing regular updates as time goes on, both on Bitcoin and other Altcoins such as Siacoin, Verge, EOS, Ethos, Po.et, Tron, Reddcoin, and others. If you would like to see the original post from two days ago, you can find it here: https://steemit.com/cryptocurrency/@lorvain/bitcoin-usd-btc-1-hour-chart-analysis