Spotted something strange in BTCEUR market
12/01/2019/20:00CET
To read charts effectively, one must become acquainted with the behaviour of each chart. Each pair has its own personal behaviour and the better you understand this behaviour, the better you can read the data contain within it.
Another important skill is to that of observation and detection of anomolies. Strange things that may indicate certain behaviours. When such things repeat, it can become possible to predict the reappearance of this behaviour and trade in anticipation of it.
Why do I take about this?
Well I found a strange thing in the charts of the BTCEUR pair on bitstamp.
Check this out...
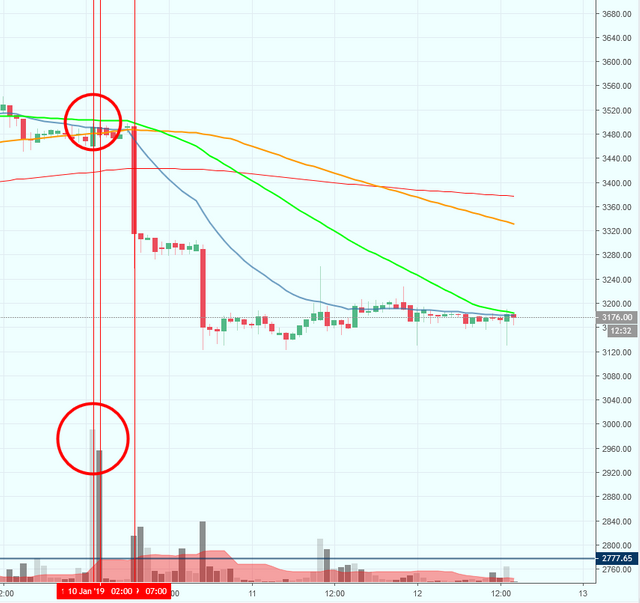
- remember we are looking at the EURO price of bitcoin
- Check out the huge vol spikes before the sudden drop. (1470 and 1270 btc traded on each of these hours. One green and one red candle. but price moved less than €40
- And the relatively lower volume on the sharp red candle (450 btc traded on this large red candle that lost €240 in one hour)
- The volume in the hours between these 2 events are very low.
This is strange behaviour. I have checked the chart for any other historic example of such behaviour and found nothing like it.
So I am still scratching my head
Any idea guys?