BTC Chart - Not out of the woods
I have read a few things about BTC breaking out of the trend etc....Whilst it did poke out I am not sure we are done yet.
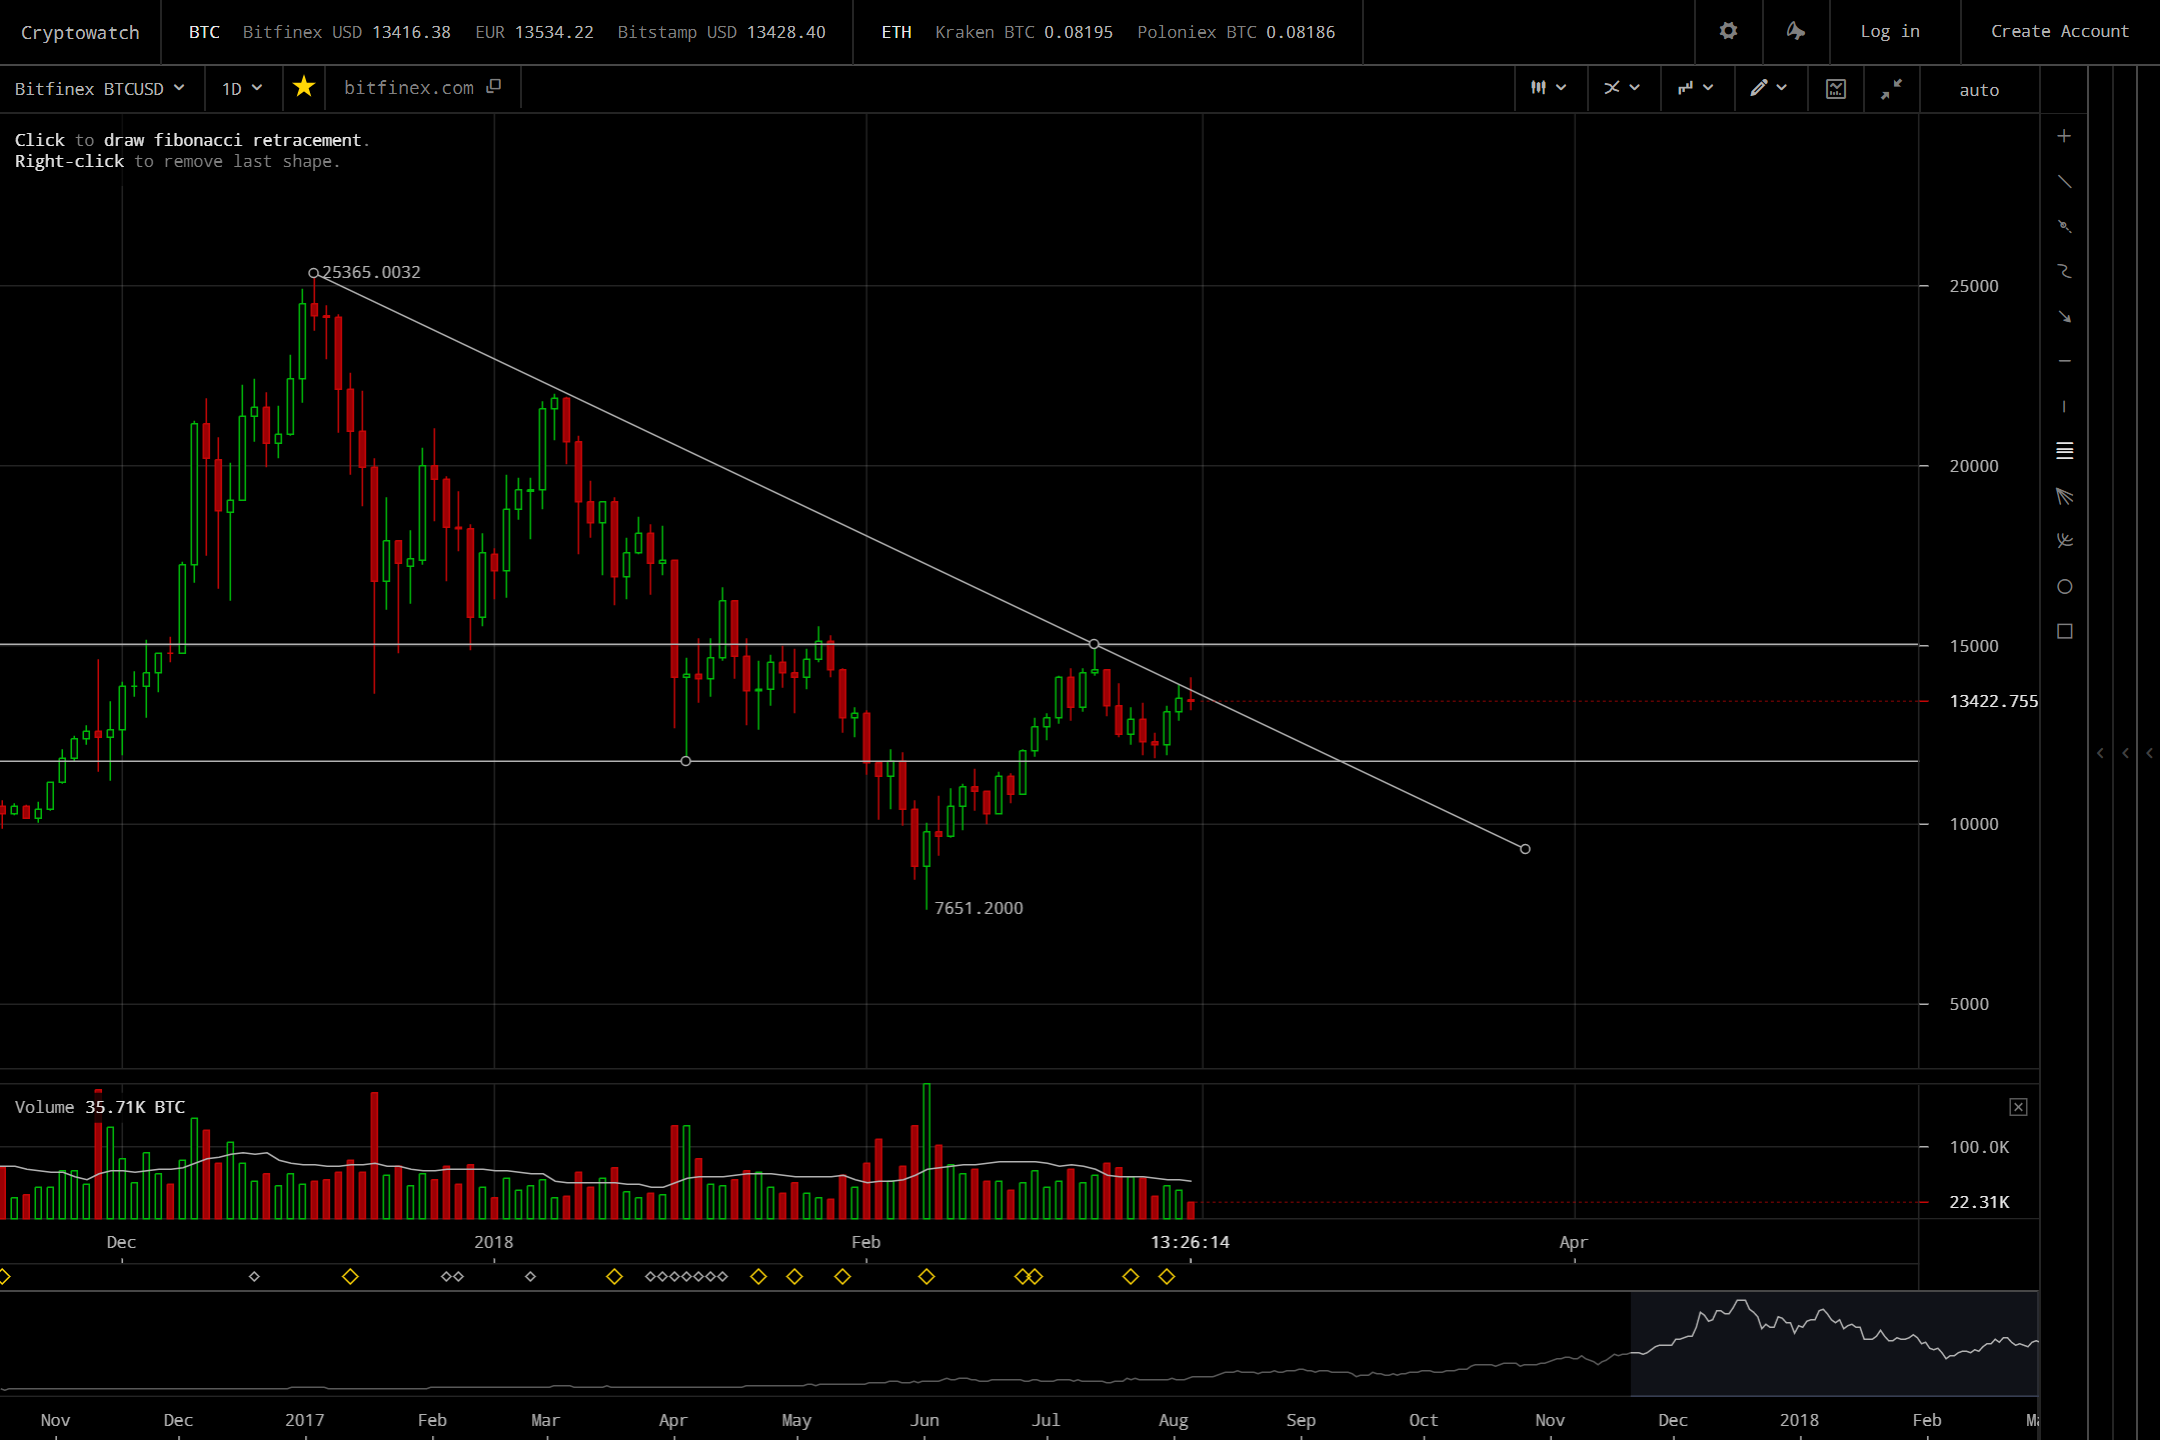
Based on the chart below we are at a crucial point, touching but getting some rejection of the downward trend line. I also drew a fib and current price is also at the 61.8% level (I didn't leave it as the chart was looking messy)
The way I trade is I draw in crucial lines and look for price action (candlestick behaviour) to guide me. The latest candle is telling me we may have another dip left before a pop (if it does pop). The next level down I am watching is that lowest white line at approx 11850 AUD (9300 USD).
Lets watch and wait.
Please leave some feedback on if you would like me to write on the charts and change the colours.
.png)
I hope crypto will be less volatile some days. Until then I will stay trading Forex and hodl crypto. Check out my technical analysis blog and consider following me. Hi 🖐🙂
Do you daytrade forex? I used to do forex but stopped for some studies and then got into crypto. I am considering getting back into it.
I will look at your blog for sure!
No, I think that daytrading is for robots. I don't like how crypto charts are volatile and short..