February Price Analysis of Major Cryptocurrencies
BTC/USD
We were expecting #Bitcoin to retest the lows after turning down from the trendline. But the bears could not break below the $8,000 mark.
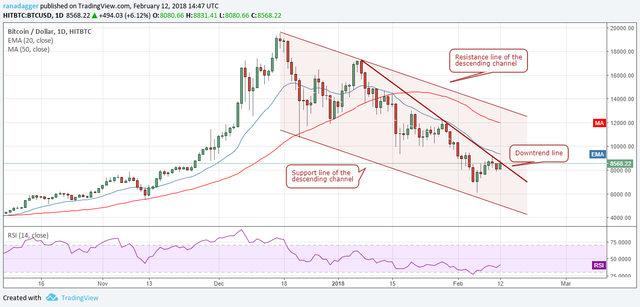
Currently, the price is likely to face resistance at the downtrend line and above it, at the 20-day EMA. We expect the $8,600 to $9,400 levels to be a real test for the bulls.
If they succeed in breaking out of this zone, a quick rally to $12,000 might take place, where it will again face resistance from the 50-day SMA and the resistance line of the descending channel.
Therefore, the traders can wait for a breakout above $9,500 to buy. The stop loss for the trade should be kept at $7,800. The profit objective is a move to $12,000.
And what if the BTC/USD pair fails to break out of $9,500 and turns down once again?
In this case, traders should wait, resisting the urge to buy at lower levels because if the price breaks below $7,800, we might see it go down to the $7,000 point.
We always provide both the bullish and bearish scenarios because the traders should be aware of what to expect in both cases. It would be irresponsible to provide levels only in one turn of events.
ETH/USD
After a two-day dip on Feb. 10 and Feb. 11, Ethereum is also attempting to move up.
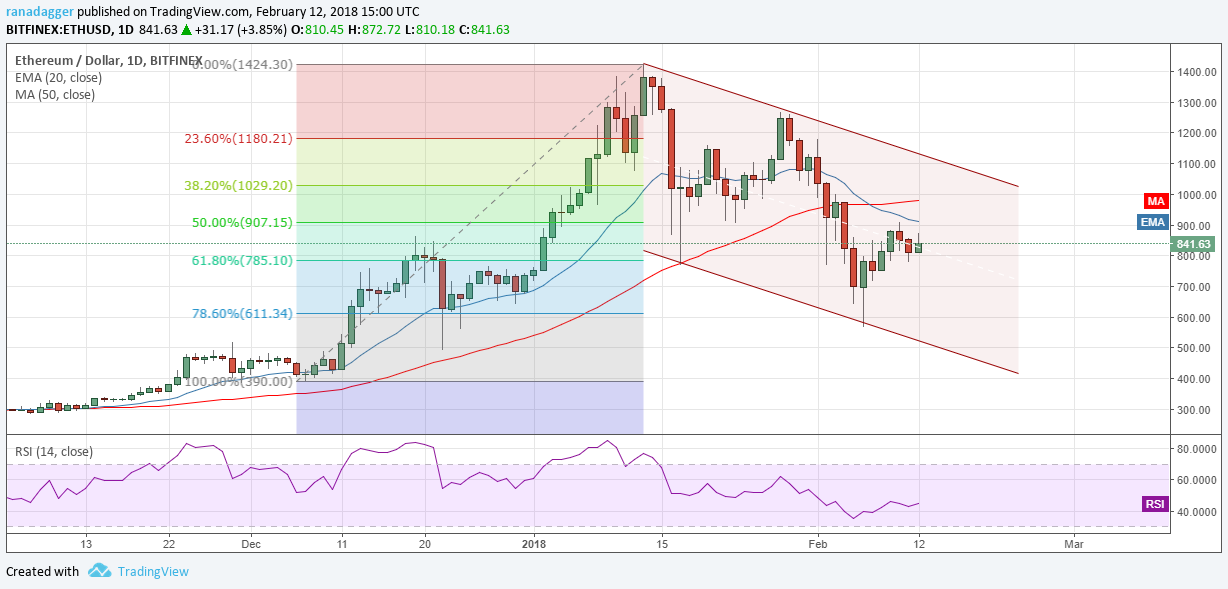
#ETH/USD pair is likely to face resistance at $911 from the 20-day EMA and at $980 from the 50-day SMA. Above these levels, the price may move to the resistance line of the descending channel, at about $1,050 levels.
On the downside, $775 has strong support.
It doesn’t provide good risk to reward ratio, so we are not suggesting a trade on it.
BCH/USD
Bitcoin Cash has been trading in a small range for the past four days. It might resolve with a large range day, either to the upside or downside.
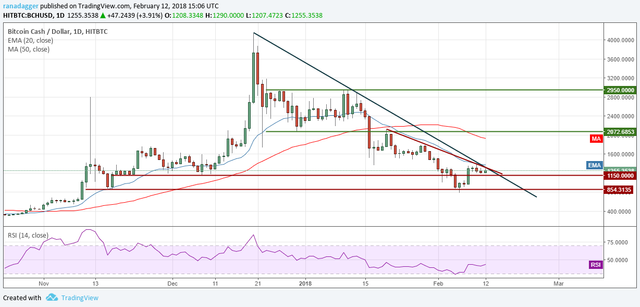
If the large range day goes downside, we’d better avoid doing anything.
But if the BCH/USD pair breaks out of the downtrend line and the 20-day EMA, it will signal a short-term bottom, which can be traded.
Therefore, we think a long position at $1,400 with a stop loss of $1,100 might be a smart move. The profit objective of this trade is a rally to the $1,925 - $2,000 levels.
XRP/USD
We had written about the possibility of a short-term bottom in Ripple. We have been waiting for a rally above the 20-day EMA to initiate long positions.
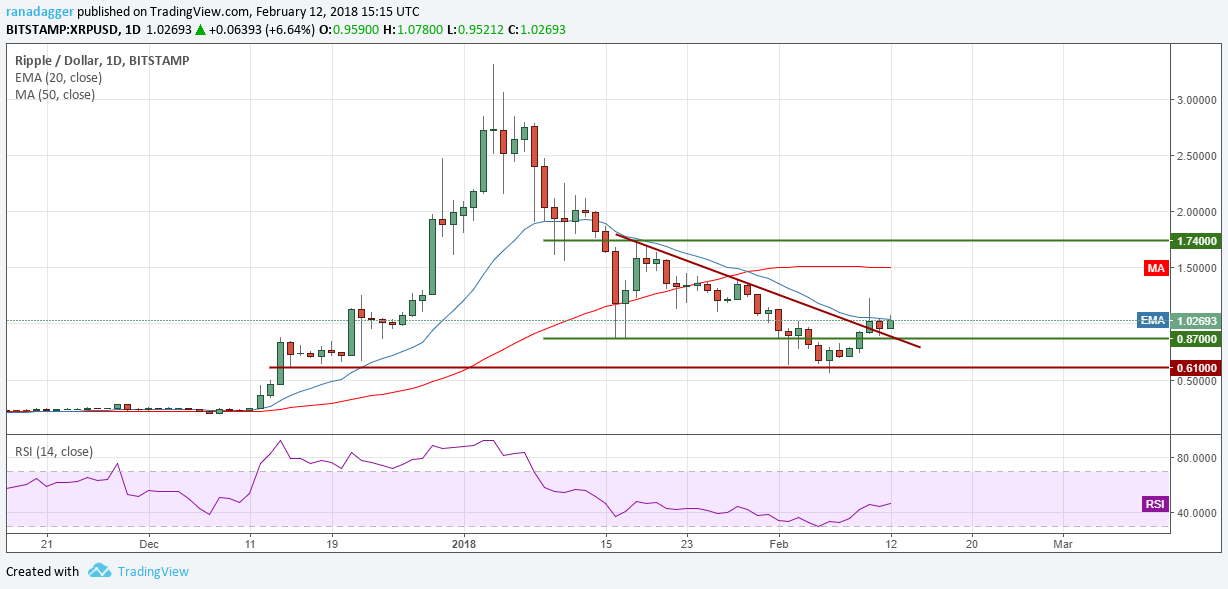
On Feb. 10, the XRP/USD pair broke out of the 20-day EMA but could not sustain higher levels. Right now, it is again at the 20-day EMA. We believe that if the bulls sustain above the $1.1 levels for four hours, we can expect a rally towards the 50-day SMA at $1.5. If this level is crossed, a move to $1.74 is likely.
The traders can keep a stop loss at the $0.86 levels, which is just below the previous support. #Ripple has been an underperformer in the current fall, hence, please trade with only 50 percent of the usual position size.
XLM/USD
Stellar has continued its range-bound trading action for the past few days. Attempts to rally have been facing strong resistance at the $0.41 levels.
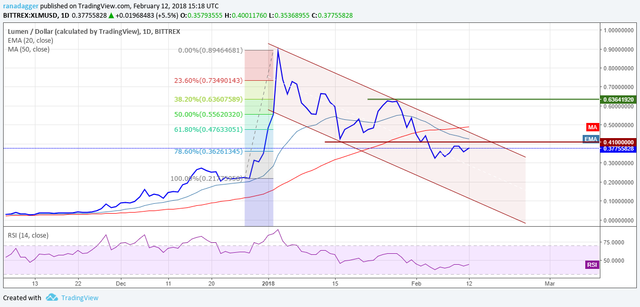
If the bulls succeed in breaking out of the descending channel, we anticipate a rally to the $0.63 levels. We don’t find any long trade until the XLM/USD pair trades inside the channel.
On the downside, if the cryptocurrency breaks down of $0.3 on a closing basis (as per UTC), it can slide to the support line of the channel.
Therefore, we’d better wait for a breakout of the channel to initiate any long positions.
LTC/USD
We had advised on long positions in Litecoin if the breakout sustains above the $175 levels. However, for the past three days, the bulls have been struggling to clear the 20-day EMA hurdle.
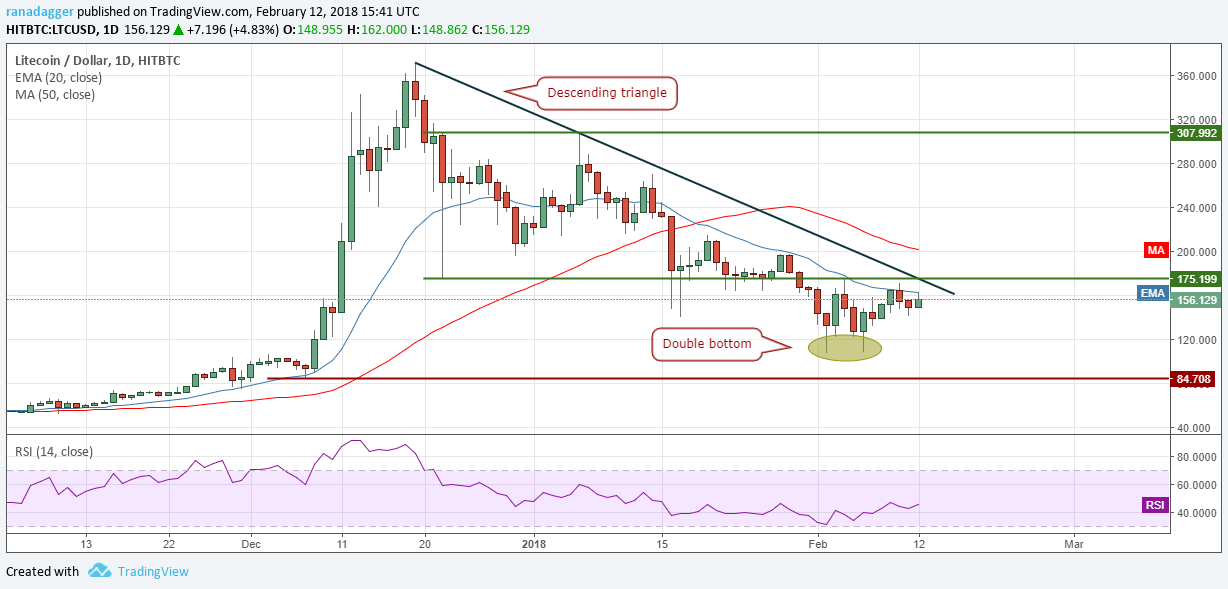
If the price breaks out of $175, it will clear the resistance from the 20-day EMA, the downtrend line, and the horizontal line.
We believe that this is a significant development. That’s we reiterate our recommendation to initiate long positions if the LTC/USD pair holds above the $178 levels for four hours.
The stop loss for the trade can be kept at $130.
On the upside, $200 is resistance. If the cryptocurrency struggles at this level, we should close the position or tighten the stops.
Once the bulls break out of $200, we might see a rally to $307.
ADA/BTC
Cardano continues to trade inside the descending triangle pattern. This is a bearish setup, and a breakdown of the support at 0.00004070 will complete the pattern.
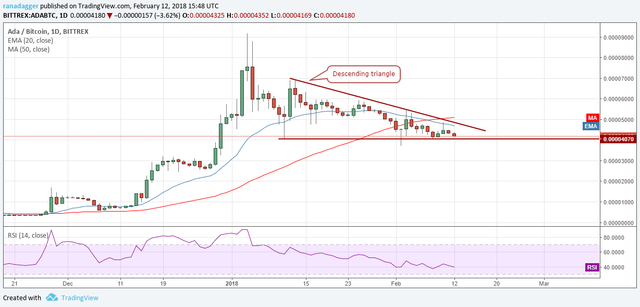
Though the target of this breakdown is way lower, we expect the ADA/BTC pair to find buying support at the 0.0000246 levels.
Failure of a bearish pattern is a bullish sign. Therefore, if the cryptocurrency turns up and breaks out of the 20-day EMA, the downtrend line of the descending channel and the 50-day SMA, we need to reverse our position and go long.
Until then, consider staying away from it.
NEO/USD
In our previous analysis, we had recommended a long position on NEO above $120 levels with a stop loss of $100.
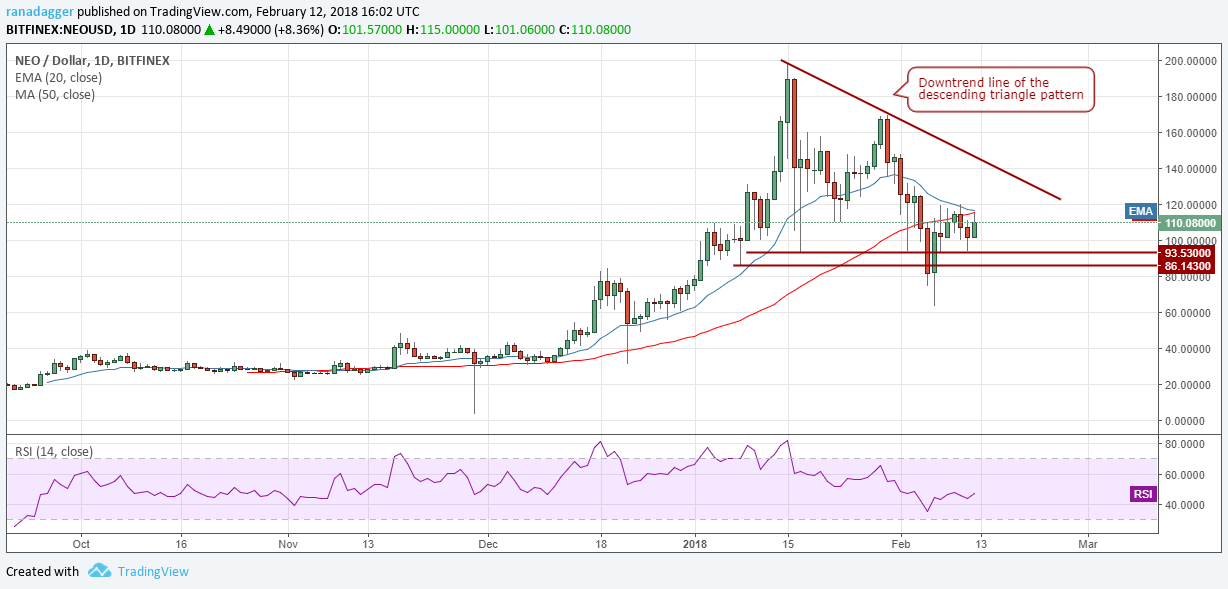
Though the price reached an intraday high of $120.33 on Feb. 10, it could not settle at the levels. Therefore, traders should wait for the price to sustain for at least four hours before buying the breakouts.
On the downside, $93.53 again acted as strong support yesterday, Feb. 11.
The NEO/USD pair is stuck in a range of $93.5 on the downside and $120 on the upside. A breakout of this range is likely to propel the cryptocurrency towards the downtrend line of the descending triangle.
Traders can buy on a breakout above $121 if the price sustains the level for at least four hours. The initial stop loss should be kept at $93, which should be trailed higher if the bulls fail to break out of the triangle downtrend line.
But in case, if the NEO turns down from the moving averages and breaks down of the $93.53 levels, it might become negative.
Citation
Upadhyay, Rakesh. "Bitcoin, Ethereum, Bitcoin Cash, Ripple, Stellar, Litecoin, Cardano, NEO, EOS: Price Analysis, Feb. 12" Coin Telegraph, 11 Feb. 2018.
Good analysis. Concise and informative.
You have provided information not just on Bitcoin but other cryptocurrencies too.
Fantastic job :)