🚨 All of this has happened before, and all of this will happen again 🚨 - Cryptocurrency/Bitcoin bubble flashbacks -- I see 100% the same things as back during the last bubble - Bitcoin is not going to keep going up forever, and here is why 📉

History is doomed to repeat itself, and this seems true in cryptocurrency also. I've been in the scene for about 3-4 years now and I am getting the feeling of deja vu. And I'm not just talking about the charts.
It's the same hopes, fears and hypes. Ranging from companies introducing 'Whoppercoins' (I swear I remember this happening back in 2013-2014 too but I can't find it online as proof), to celebrities promoting certain coins. It's like a repeat of news messages - Is it a bubble, is it not a bubble? Who is Satoshi Nakamoto? I remember being in Litecoin chatrooms, part of a massive 'battle' to set up Buy Walls so we could attempt to increase the price - then these days I find myself in similar chats, but different coins, doing the same and getting flashbacks to the days of old.
It seems like history is repeating itself, and doesn't remember doing all of this a couple of years before as well.
So let's look at the charts.
source: http://www.marketoracle.co.uk/Article43861.html
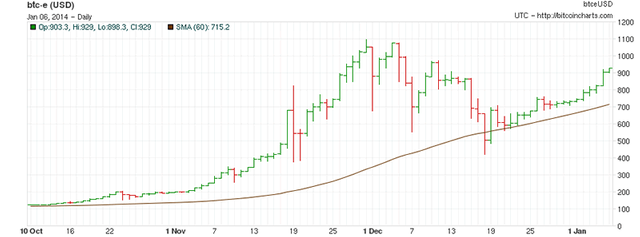
Looks familiar? Look again.
Look at the date. This is the Bitcoin chart from back in 2014 right after hitting all time highs. Notice how similar it looks to today's Bitcoin graph.
This is approximately what happened next, graph taken from another site:
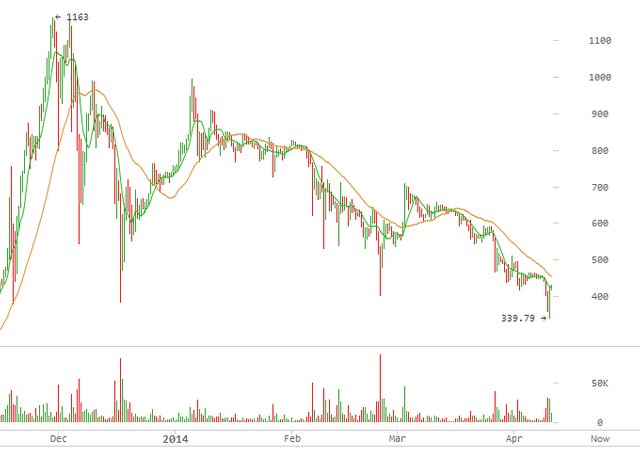
source: http://www.zerohedge.com/news/2014-04-11/bitcoin-bubble-bursts-digital-currencies-find-they-have-dilution-problem
Now let's look at what those hocus-pocus technical analysts say. Elliot Wave Theorists have already speculated back in 2013-2014 that price would drop below $500, but eventually would bounce back up to new highs. Take a look at this article from cryptocoinsnews from 2014 where they explain how Bitcoin was able to crash below $500. Interestingly, this article states that the crash happened right around the time China imposed restrictions on Bitcoin.
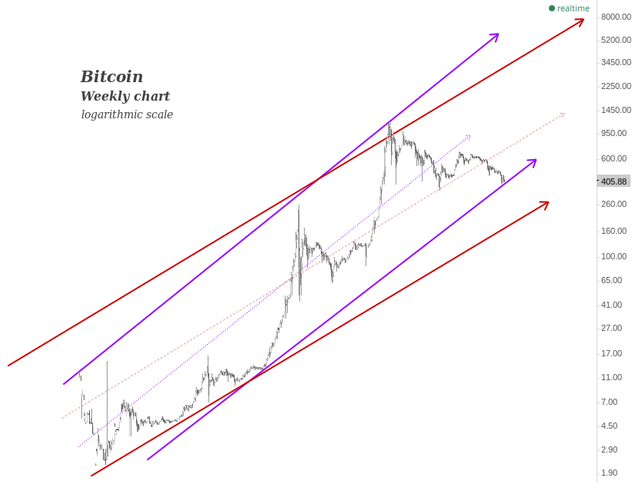
One of the tools they use is the logarithmic scale graph. It makes the Bitcoin chart look like this:
source:https://www.cryptocoinsnews.com/bitcoin-crash-500/
As you can see on this chart, a logarithmic channel exists and it predicted (back then) that Bitcoin would top at $1200-1400 and then dip to about $300-400.
If we apply this theory to today's Bitcoin chart, you can almost fill in the blanks on the chart above, it becomes clear that according to this chart we should be going up as high as $5000-8000 before hitting the top of the channel, after which a decline is due to happen back to (possibly?) $1500 before bottoming out.
This made me think of Steemian @haejin, who applies Elliot Waves Theory and has recently predicted Bitcoin will rise to about $7000, and then suffer a massive decline all the way to below $500. Go watch his content and specifically this video here. I found it very interesting to see that Elliot Waves Theory has produced more or less the same prediction as it did three years ago. This, in my mind, strengthens the prediction significantly.
And from personal experience based on history, I know that a crash must be coming. Unless of course, this time things are different.
But then I remember, how last time things were different too. And how last time, we supposedly weren't in a bubble either.
The problem then becomes how to spot the top. It also shows that we are in a pivotal time right now. If you look at the similarities to the last bubble, then the current bull run is going to determine the course of Bitcoin. If the bulls can breach previous highs at $5000, then the run can continue up. However, if our second top is below the $5000 and we decline from there, it seems to me like we have topped out and will be on the decline for months to come after that.
Take this information how you will, and take it with a grain of salt as well. Everybody needs to make up their own mind investing, but I am keeping this information close to my heart when I decide on when and how to invest in crypto. It's foolish to believe that we can have four nearly identical Bitcoin bubbles, and this won't be the fifth time.
You can take solice in the fact that, according to the logarithmic chart, after we have suffered through the next Bitcoin depression - Prices should go up and higher than ever before - $25,000 seems completely possible for the next bubble after this one.
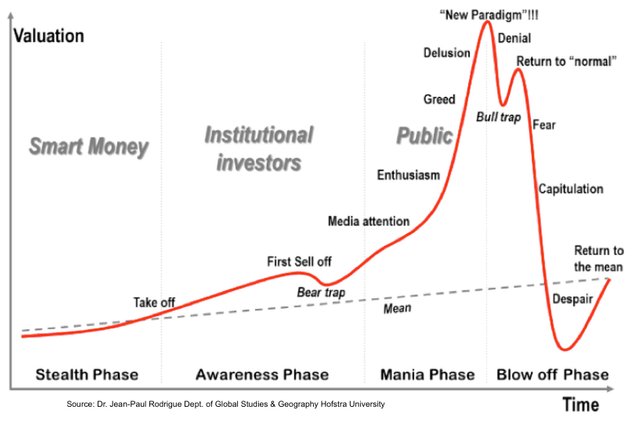
I'll leave you all with this well-known illustrated chart of what a typical bubble looks like.
Nice to have a bit of pragamatism thrown into the mix
Thanks for the post. so interesting opinions and basically i agree with you
but that was one of many sites, those we must to watch out. upvoted !
Very well put! I would say this, once the crash finishes somewhere between $500 and $130 or so, Bitcoin will be hated, it will be shunned and abhored. Many accounts wll have been wiped out.
Now, THAT'S when it would be the MOST IDEAL time to BUY BITCOIN.
The old adage from the oracle of Omaha: Be fearful when others are greedy and be greedy when others are fearful.
Thank you for this alternative view! I am new to crypto and so don't have the experience to catch these things myself. All the other advice I've been seeing is very bullish without much long term analysis, so I really appreciate it!
Back in 2013/2014 all the news was super bullish too, unfortunately. That's the thing that I mean... I'm getting major deja vu's. I see a good chance that we will see new highs, but I do expect a massive crash and long period of negative action after that.
My own plan is to sell half when I think we topped out, and keep the other half in crypto. If we do rise higher I'm still in the game but if we don't then I'll have my profits which can be put back into crypto when everything is super cheap.
This post received a 1.6% upvote from @randowhale thanks to @pandorasbox! To learn more, check out @randowhale 101 - Everything You Need to Know!
Clear, concise, logical. Fantastic!
This post received a 31% upvote from @morwhale team thanks to @pandorasbox! For more information, click here! . this is @originalworks . steem @steemprice BTC
$4390.57 USD/BTCVolume: 51724.78 BTC ($227101458.88 USD)Last Updated Mon Oct 2 18:37:19 2017The @OriginalWorks bot has determined this post by @pandorasbox to be original material and upvoted it!
To call @OriginalWorks, simply reply to any post with @originalworks or !originalworks in your message!
To enter this post into the daily RESTEEM contest, upvote this comment! The user with the most upvotes on their @OriginalWorks comment will win!
For more information, Click Here!
Special thanks to @reggaemuffin for being a supporter! Vote him as a witness to help make Steemit a better place!
Awesome man! This will be again featured on my latest issue! Thanks!
I agree with you.
This post has been verified as a quality post and received a 7.14 % upvote from @binkley thanks to: @pandorasbox. .
Please Upvote My Comment To Help Me Verify More Posts.
.
Please Upvote My Comment To Help Me Verify More Posts.