Continuation Signals and Some Variants in Japanese Candlestick Charts
Windows are the Japanese trading names for price gaps
In Japanese candlestick charting a gap is typically referred to as a window. A window is an opening between the prior and the current session's prices. The example below shows an open window formed in an uptrend. There is a gap between the prior upper shadow and the lower shadow of the current session.
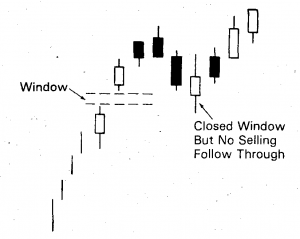
Window in an uptrend
A window in a downtrend is displayed in the following example. It shows no price activity between the prior day's lower shadow and the current session's upper shadow.
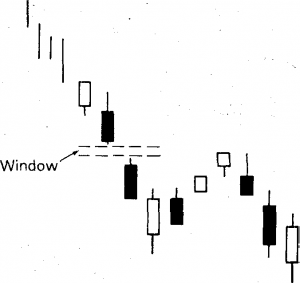
Window in a downtrend
Windows can also become support and resistance levels
A window in a rally implies a further price increase. This window should also be a floor on pullbacks. If the pullback closes the window and selling pressure persists after the closing of this window, the prior uptrend is voided.
Similar, a window in a declining price environment implies still lower levels. Any price bounce should run into resistance at this window. If the window is closed, and the rally that closed the window persists, the downtrend is over.
Corrections tend to go back to the window
Japanese candlestick charts assert that corrections go back to the window. This means that a test of an open window is probable. In other words, in an uptrend, one can use pullbacks to the window as a buying zone. Longs should be redeemed and even shorts could be taken if the selling pressure continues after the window closes. The opposite strategy would be justified with a window in a downtrend.
In the example below, we see window 1 and 2 during a rally which started with the bullish engulfing pattern. A bearish shooting star originated after window 2. The day after this shooting star, the market opened lower and closed the window (in other words, filled in the gap). Keep in mind the concept that corrections tend to go back to the window, so this pullback to the window should not be a surprise. If the window gets closed and the selling pressure was to continue, this would signal the end of the uptrend.
But this did not happen. The selling force disappeared once the window closed. Moreover, the support set up at window 1 remained. The following week the market shuffled its feet and then retested support at window 2. After this successful test, the market pushed forward and opened window 3. This was a significant window because it represented a gap above the old $1.10 resistance level, which once broken, became support.
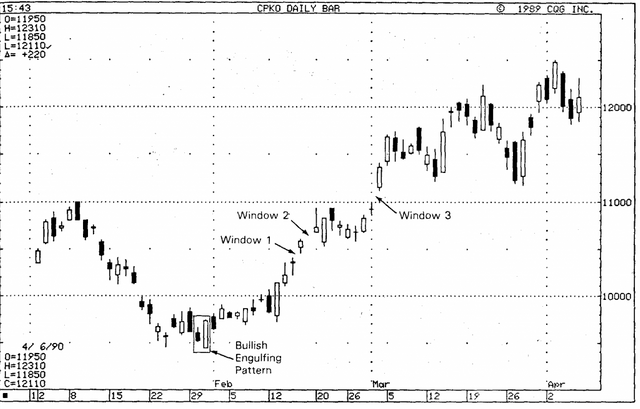
Example of windows at support and resistance levels
Windows as an upside breakout
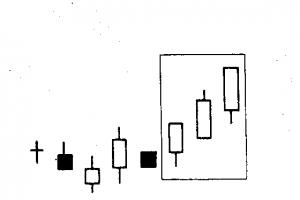
Besides the use of a window as support or resistance area and as a continuation pattern, there is another use. A window, made with a small black candlestick from a low price congestion area, can signify a meaningful upside breakout, as is shown in the example chart below.
At the next session, this window was confirmed as support. The market not only held the window as a support but produced the strongest type of candlestick line, a long white candlestick that opens on its low (called a bullish belt-hold line) and closes on its high.
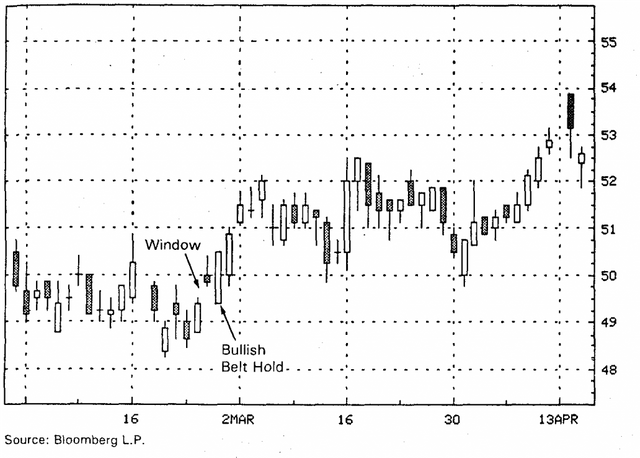
Example of a window from a low price congestion area
More illustrations of the significance of the number 3
Japanese technical analysis assumes that after 3 up or down windows, chances are high that a top (in the case of an uptrend) or a bottom (in the case of a downtrend) is near, especially if a turning point candlestick pattern or line shows up (such as a doji, piercing pattern, or dark-cloud cover) after the third gap. In the below example this is illustrated by the hanging man lines after the third window.
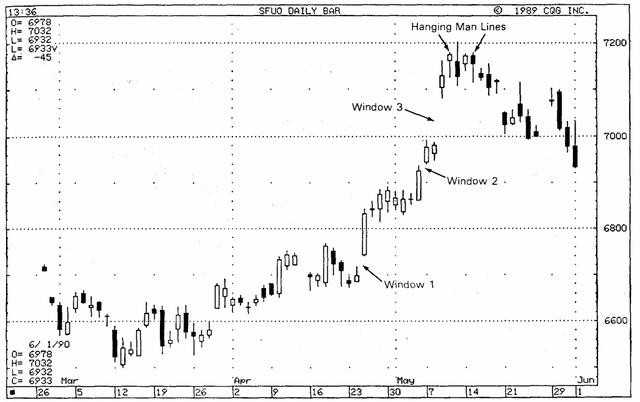
Example of 3 windows
Rising and falling 3 methods
The rising 3 method pattern includes:
- A long white candlestick
- This white candlestick is followed by a group of falling small real body candlesticks, ideally 3, but 2 or more than 3 are also valid as long as they basically hold within the long white candlestick's range. Although black is most common, these small candlesticks can be any color.
- The final day must be a strong white real body session with a close above the first day's close. And this final candlestick line should also open above the close of the prior session.
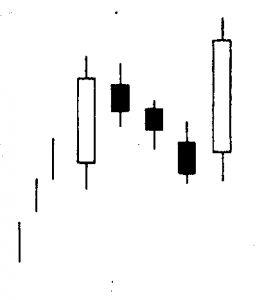
Rising 3 method
The falling 3 method pattern is the bearish counterpart of the rising 3 method pattern. The market should be in a downtrend and a long black candlestick should occur. The black candlestick is followed by 3 (usually white) small rising candles, whose real bodies hold within the first candlestick's range (including the shadows). The final session has to open under the prior close and then close under the first black candlestick's close. The market will head lower after this last black candlestick session.
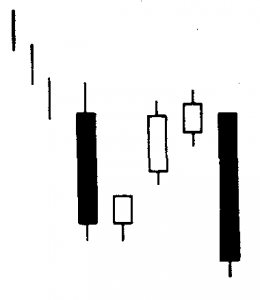
Falling 3 method
3 advancing white soldiers
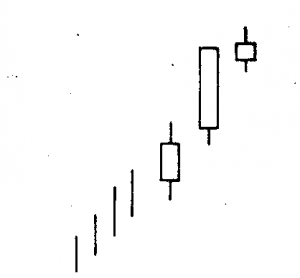
The 3 white soldiers pattern consists of a group of 3 white candlesticks with consecutively higher closes. If this pattern appears at a low price area, after a period with stable prices, this signals strength ahead. The 3 white soldiers are a gradual rise with each white line opening within or near the previous session's white real body. Each of these white candlesticks should close at, or near, its highs.
3 advancing white soldiers
If the second and third (or only the third candlestick) show signs of weakening it is an advance block pattern, which means that the rally is running into trouble and that longs should protect themselves. Especially during a mature uptrend, one must be cautious about this pattern. Signals of weakening could be progressively smaller white real bodies or relatively long upper shadows on the last 2 white candlesticks.
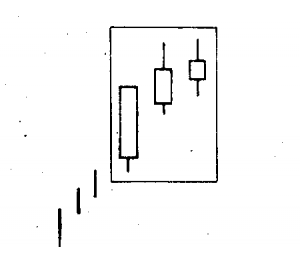
Advance block
When the last 2 candlesticks are long white ones that make a new high followed by a small white candlestick, this is called a stalled pattern. After the formation of this pattern, the bull's strength has been exhausted, at least temporarily. The last small white candlestick can either gap away from the long white body, in which case it becomes a star. The small real body discloses a decline of the bulls' power. When the stalled pattern occurs, it is time for the longs to take profits.
Stalled pattern
The advance block and stalled patterns are no top reversal patterns, but sometimes they can lead to a meaningful price decline. Most of the time they manifest at higher price levels.
In our next blog post, we will dedicate our attention to a highly important trend reversal signal, the doji.
Source: Japanese Candlestick Charting Techniques (by Steve Nison)
Posted from my blog with SteemPress : http://companywebsolutions.com/continuation-signals-and-some-variants-in-japanese-candlestick-charts/
This user is on the @buildawhale blacklist for one or more of the following reasons: