7 crypto-infographics that can give you food for thought
Statistics is regarded as one of the biggest types of lies. And this is right when you want to manipulate someone’s opinion.
However, if you don’t let your emotions overwhelm you, some interesting ideas can be found in all these graph and maps. Let’s start.
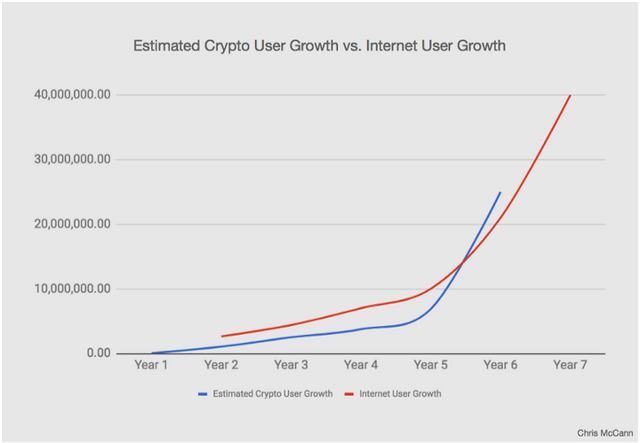
1. This graph is a bit outdated, it finishes at the year 2005 and there are no cryptos. But one can compare them with internet.
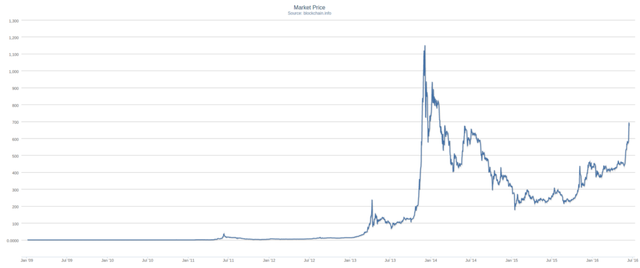
2. There’s been much talk that crypto boom is very much alike dot-com bubble in the beginning of the millenia.
3. The best advice at all time for crypto-enthusiasts. Never buy at hype.
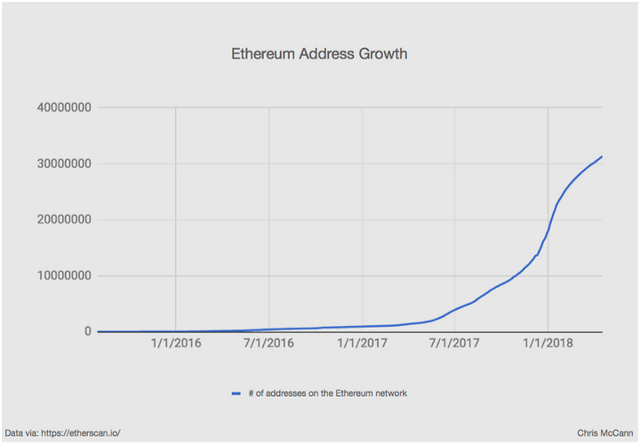
4. Despite all ETH’s faults and issues, the number of Ethereum wallet addresses keeps growing at a stable pace.
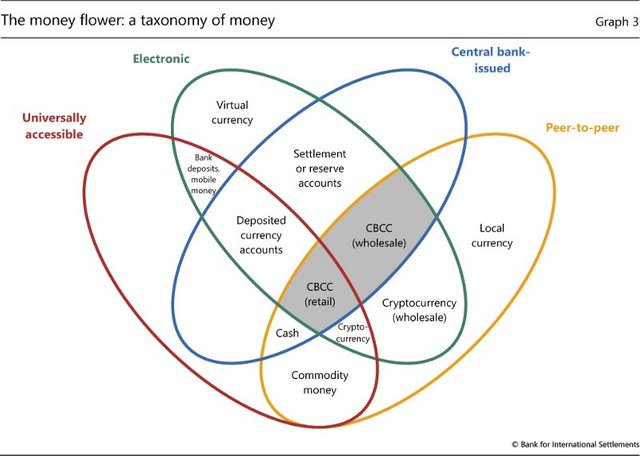
5. When I was engaged in web-design, there was a similar infographics about client’s demands. It combined only 3 parts: price, quality and speed. And it assumed that it was impossible to find a cheap and fast web-developer at the high quality level.With crypto, you can expand your horizons.
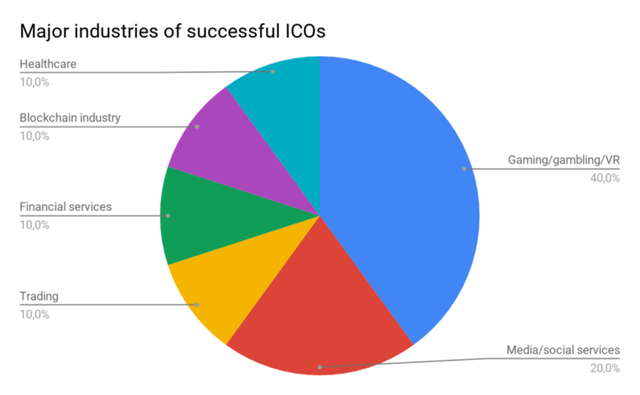
6. Gambling industries were the first ones to grasp the advantages of decentralized payment technology. Hope to see others join the party soon.
7. US, Russia, India and China. 4 whales of the crypto-industry.