Relative Strength Index (RSI)
What Is a Relative Strength Index (RSI)?
RSI is used to describe a momentum indicator that’s often deployed in technical analysis for evaluating price changes. Often, the RSI as an indicator can provide hints on the possible value of a security or cryptocurrency as it tells you with fairly decent accuracy if an asset is oversold or overbought which could have significant consequences on its future price.
How does the RSI indicator work?
Typical of any indicator metrics, the RSI always falls between two extreme zones – 0 & 100. Of course, its values aren’t fixed, so fluctuations can tell a crypto trader, with a deep knowledge of technical analysis, if an asset is grossly oversold.
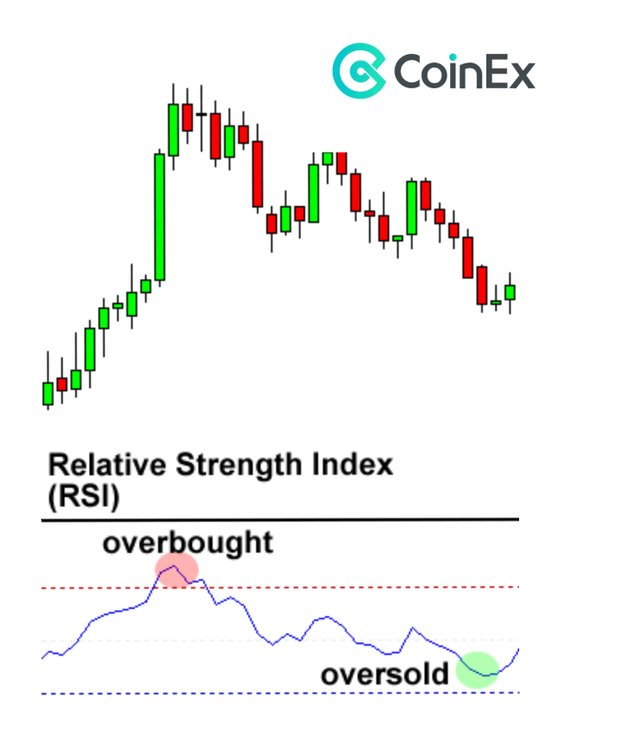
The consensus is that when the RSI for a specific asset approaches 100 ( greater than 70) then that security or cryptocurrency is overbought, suggesting the price will drop below the current price in a reversal trend. It’s often wise to sell off such assets during this period and wait to catch the bottom.
Being a momentum oscillator, the RSI can go move downwards, in this case, 30 is the mark. When such happens, the asset under review is said to be oversold, which is an indication that the security or cryptocurrency is currently underpriced. When such happens, traders are expected to buy more of the asset as prices should go up, but unfortunately, technical analysis isn’t the only decider of price in recent times.
While the RSI is known to change, bullish or bearish trends can have the indicator hanging around a specific range though with a support or resistance range depending on the trend. It’s worth noting that the value of the range is strongly linked to market sentiments for the asset as well as whatever parameters defined for the RSI.
There’s also the possibility that prices can change towards a direction that isn’t in line with the RSI indicator. This is often an indication that a price adjustment might happen.
The Formula for RSI
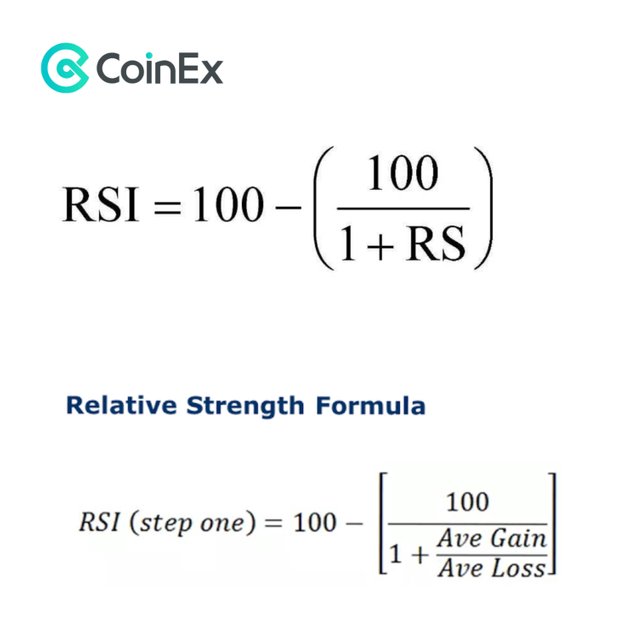
The RSI can be computed using the formula below:
RSI =100−[1+Average lossAverage gain100]
The average used in the above formula is that obtained from a previous phase. Also, while losses tend to be negative, a positive value is preferred for an RSI value.
The value of the RSI is often based on a timeline of 14 periods, which could be days, hours, or something similar. With the average gain or loss over a definite number of periods compiled, the RSI can be initially put together using the formula above.
If the data from the 14 periods are obtained, then the RSI can be further calculated using the formula:
RSI step two=100−[1+−((Previous Average Loss×13) + Current Loss)(Previous Average Gain×13) + Current Gain100]
Calculation of the RSI
With the right parameters, you can use the formulas highlighted above to calculate the RSI. The series of values obtained can then be used in a graph, for identifying the price trends.
Once the RSI values are entered on a graph, you’d notice that crests and troughs are formed in line with the number of positive and negative closes. And we can’t forget about the impact of the second batch of figures obtained using the second formula – keeps the RSI values within the two extremes 0 & 100.
As previously stated, the RSI indicator is likely to remain within the crest area when graphically represented, even for long spells, but this is largely dependent on the trend for the specific asset.
There’s also the likelihood that the RSI indicator might remain around the trough segment for long spells if the asset is struggling with a downward trend. Though complex at first, getting a hang of the RSI indicator in the face of different market trends could make a whole of differences.
What Does the RSI Help?
If you intend to comprehend the RSI indicator, you have to maximize the use of the asset trend – it can do a lot more than many are aware of. This reveals things about the RSI values for an asset in a bearish trend is beneath the 70% mark and above the 30% mark in a bullish trend.
Of course, those marks are not the exact highs and lows of the RSI value obtained for specific assets. It’s also common for traders to opt for a different approach such that the 30% and 70% marks will be used in picking the actual extremes in a truly bullish or bearish market. But this isn’t ideal over an extended period.
Traders also indulge in signals and methods that are in sync with the particular trend for that specific asset – an approach that isn’t so different from the tricks and thrills of the RSI. However, this approach is typically about putting round pegs in round holes so there are fewer poor guesses compared to the use of the RSI is made.
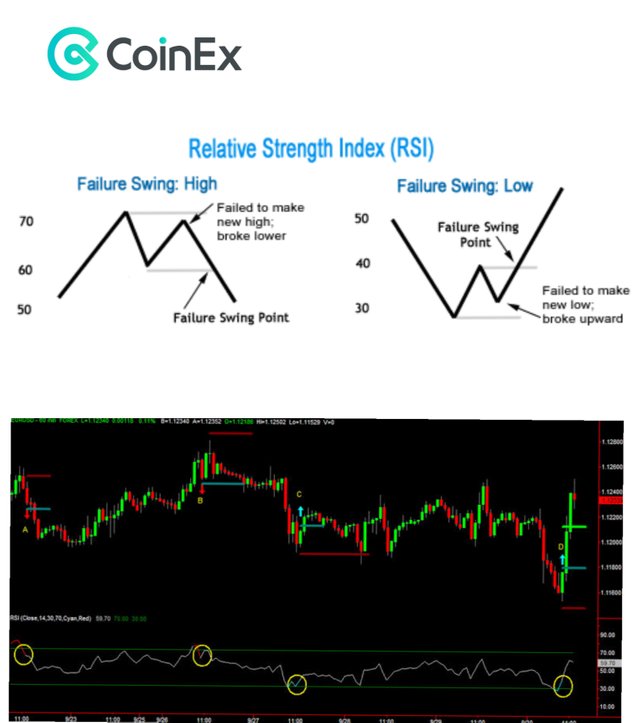
Cases of RSI Swing: Rejections
In situations where the RSI suggests that an asset is overvalued, it’s often followed by a record new low, which is often similar to the records set by the bearish trend. This is obtainable in a bullish divergence, suggesting that prices could get out of the overpriced range and into the undervalued portion.
There are also situations where the RSI indicator shows that an asset is currently undervalued resulting in prices spiking and reaching record new highs. This is the bearish divergence, and it’s often a good time to sell. Identifying the divergence for an asset with relatively stable prices isn’t so easy. But understanding when an asset is overvalued or undervalued could be crucial in the scheme of things. You’d find such in exchanges like on CoinEx.
Limitations of the RSI
With the RSI, you have an indicator that concludes pricing based on trends. Typically, the data from the RSI can only be trusted when they are in line with the trends that have remained active over an extended period.
Knowing the genuineness of a signal isn’t easy, especially with false alarms becoming a norm in technical analysis. Considering the RSI is a momentum indicator, its evaluation of assets can be misinterpreted as prices change more widely than the RSI suggests. This explains why RSI is often restricted to markets where there are just two trends to contend with.
Final Thoughts!
The Relative Strength Index is an indicator that has price prediction tendencies based on trends. Operating with a range, the indicator combined with other technical analysis tools can identify the new market trend.
Despite the shortcomings of the RSI, the indicator can make all the difference in making a profit from a bullish trend and solidifying your position in a bearish one.
Looking to get started with cryptocurrency? Buy Bitcoin on CoinEx