Electra (ECA): Mid to Long-Term Perspective - Extended Wave 5 + Possible Implications
Before I begin, I first want to note that what I will be discussing here is beyond basic knowledge of Elliot Waves Theory. Therefore, some of this may be confusing to understand. I encourage you to try to read through this whole article one or more times - if the minor detail confuse you, take a step back and try to simplify what's going on.
Let's get into it.
At the time of writing this article, Electra is in the middle of a lower-degree wave 4 correction. We see that wave 3 took us up to 40 sats, which is just about at our second Fibonacci zone of 2.62x wave 1. My analysis tells me that we may retrace a bit of wave 3, and from the bottom of wave 4, we may start the trend upwards once again until we are at the top of wave 5. The top of lower-degree wave 5 represents the top of higher-degree wave 3. Here's where things get interesting...and potentially quite exciting...
There are a few things to take note when using Elliot Waves:
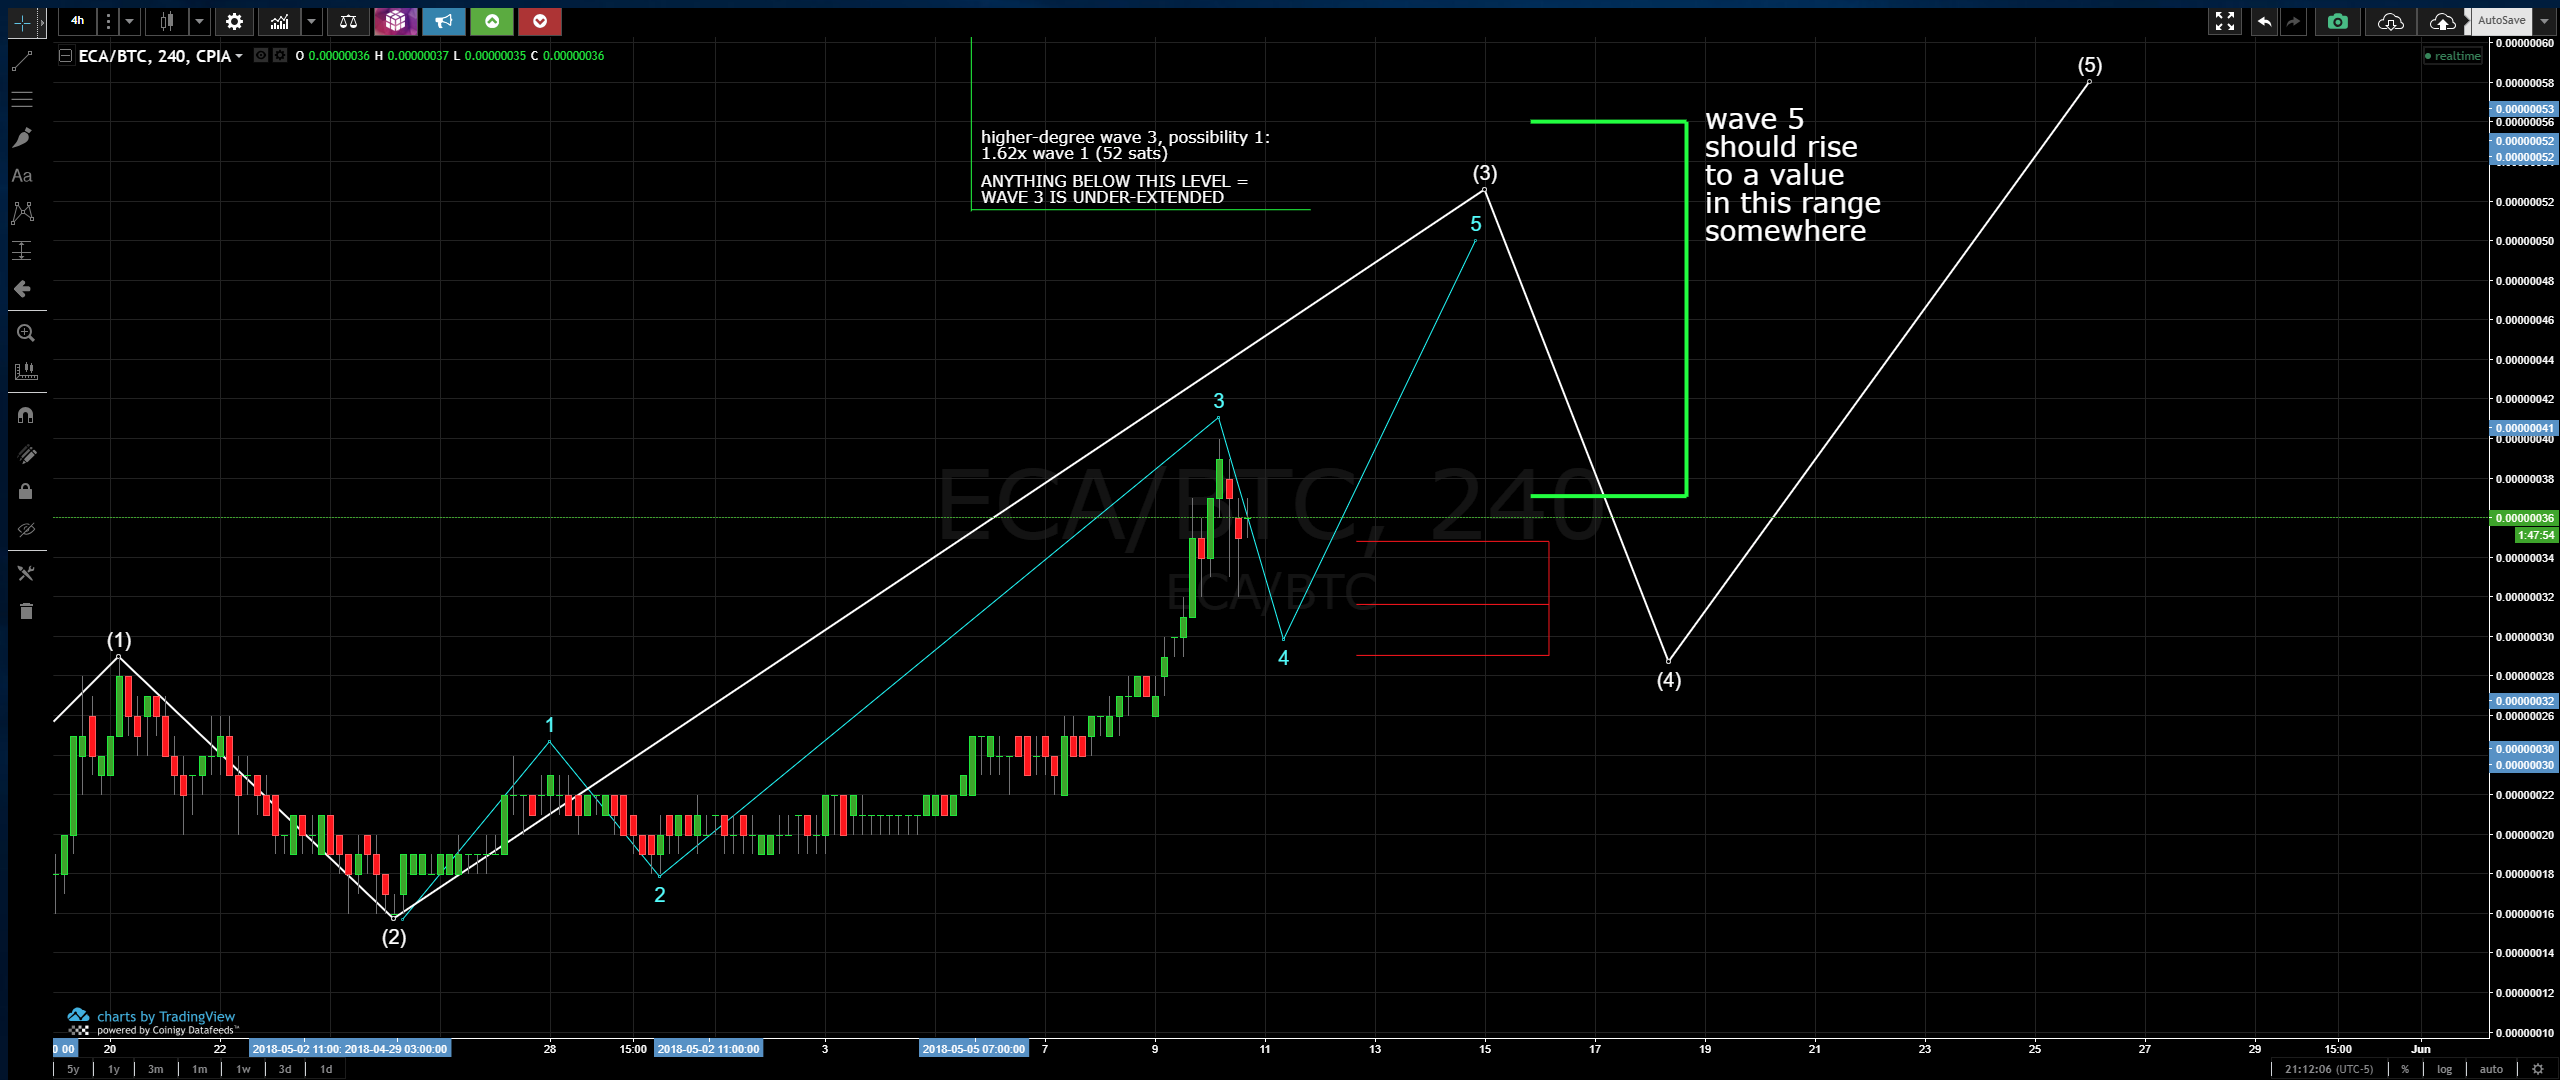
Firstly, wave 3 follows wave 1 in such a way that it tends to be 1.618x, 2.62x, or 4.25x the length of wave 1. IF wave three is less than 1.62x wave 1, it is said that wave 5 will over-extend itself. That means that our higher-degree wave 3 (lower-degree wave 5) must reach at least 52 sats, or else we very well could expect our higher-degree wave 5 to over-extend itself.
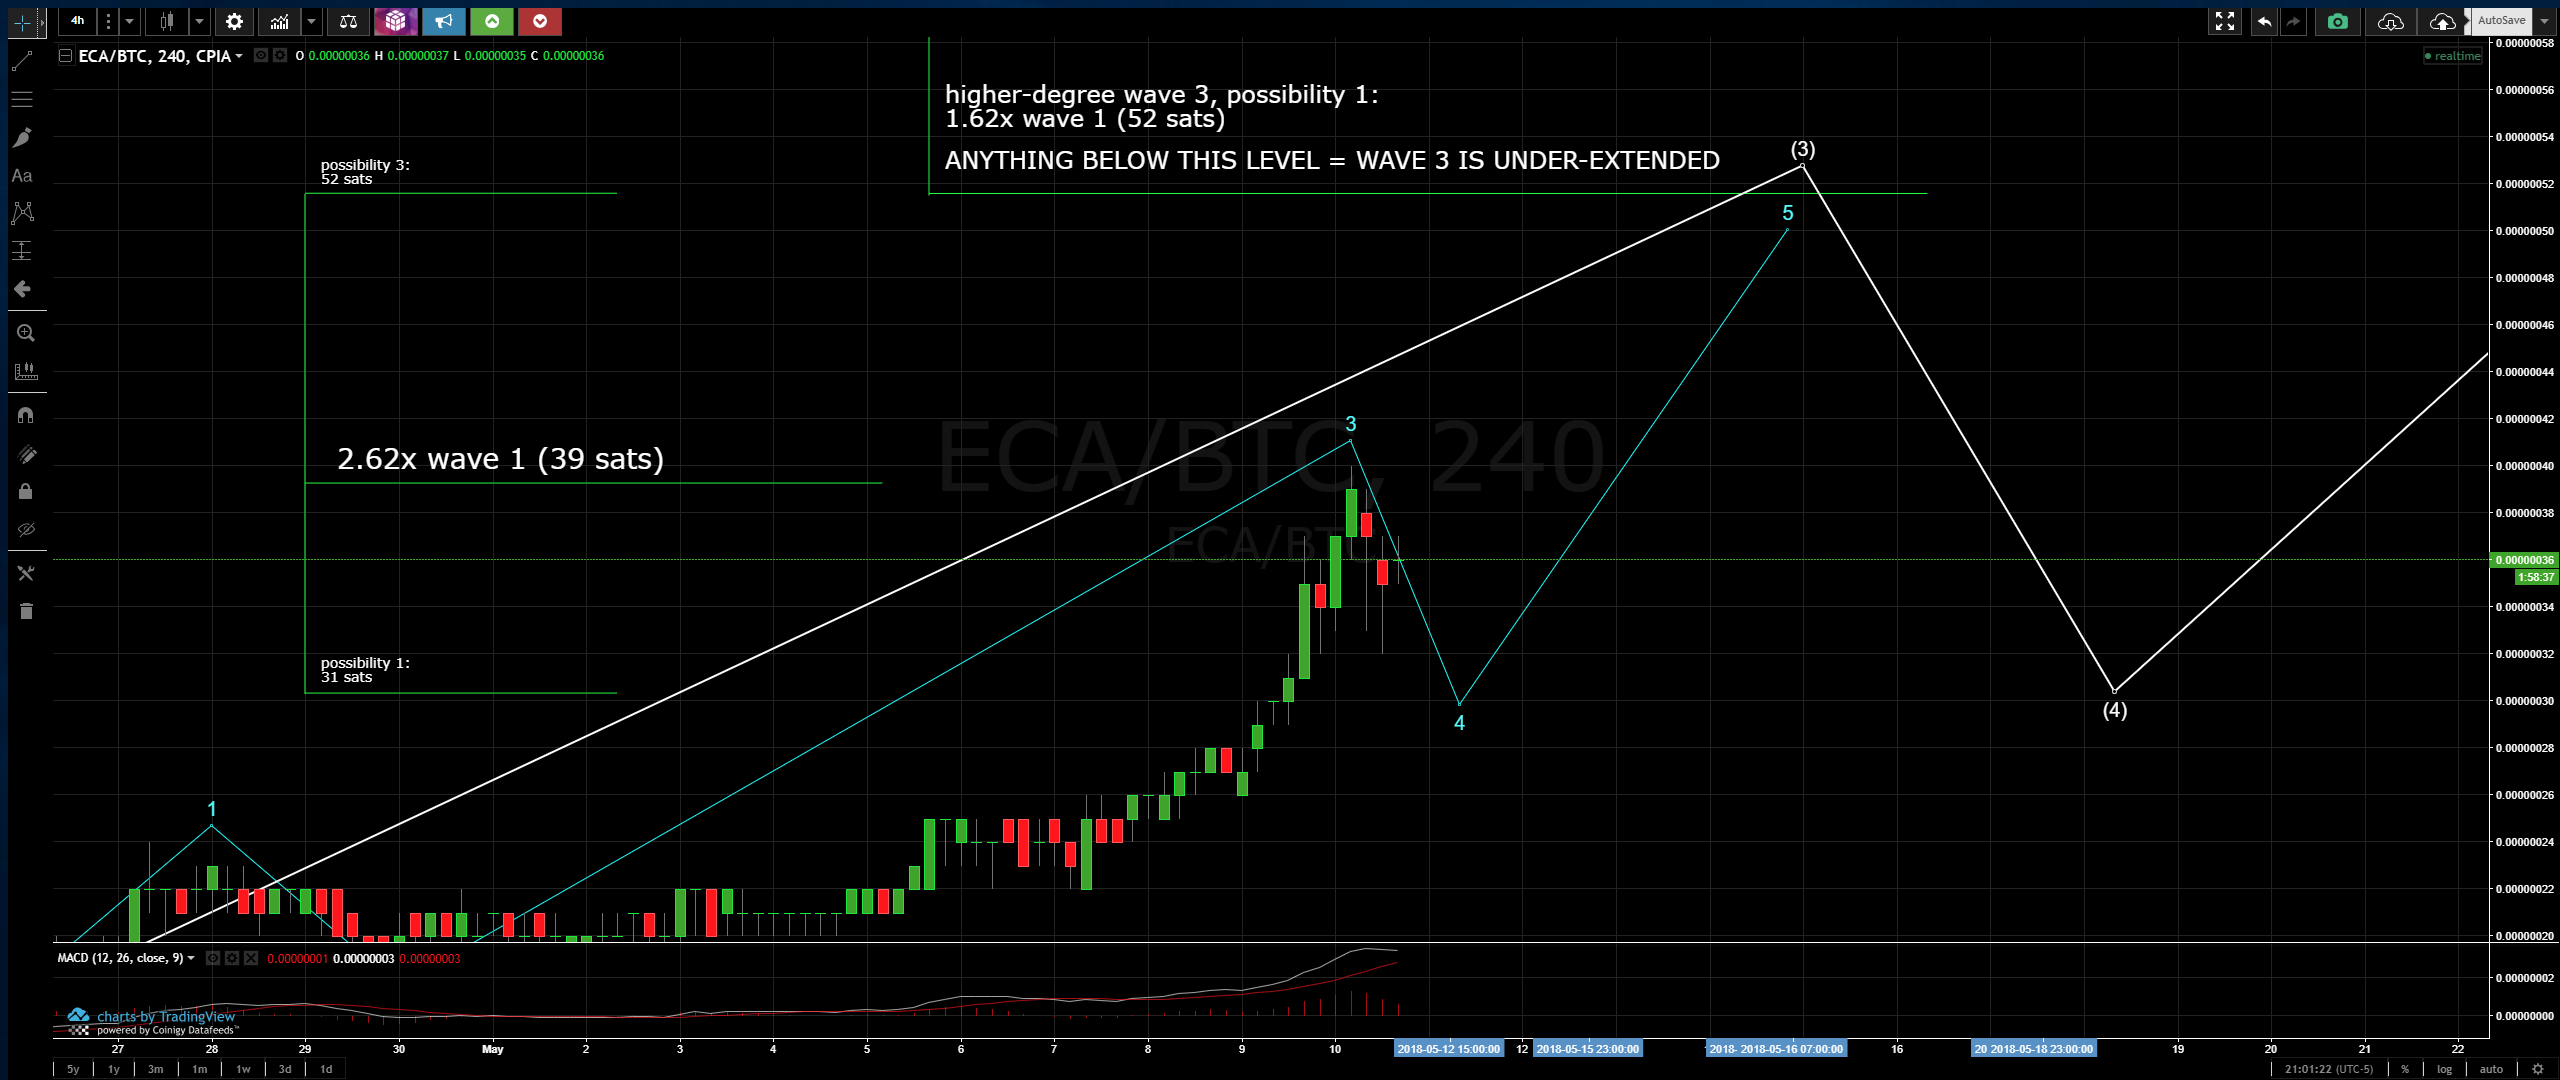
Given the current price action, things could be heading this way.
First, let's take a look at the expected value of wave 4 using our fib retracement levels:
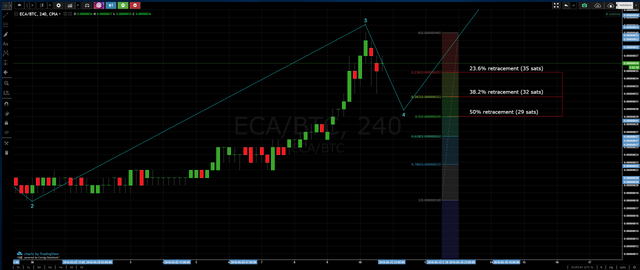
Given the fib ratios, we should expect to see a corrective wave 4 that may retrace 23.6% (35 sats), 38.2% (32 sats), or 50% (29 sats) of wave 3. Wave 5 is then said to be either 1x, 1.618x, or 2.62x the length of wave 1 (which had a length of 8 sats). That means that the length of wave 5 could be either 8, 13, or 21 sats. Now, let's consider all the possibilities of where wave 5 could actually end up. In order to get an accurate range of where 5 could be, we have to consider all three possibilities of where the bottom of wave 4 could be.
If the bottom of wave 4 retraces 23.6% of wave 3 to 35 sats, then the value of wave 5 could reach 43, 48, or 56 sats.
If the bottom of wave 4 retraces 38.2% of wave 3 to 32 sats, then the value of wave 5 could reach 40, 45, or 53 sats.
If the bottom of wave 4 retraces 50% of wave 3 to 29 sats, then the value of wave 5 could reach 37, 42, or 50 sats.
Therefore, all things considered, wave 5 could end up anywhere from 37 to 56 sats. What does this mean? It means that when we consider all options of future price movement, there is but a slim margin that could bring the top of our lower-degree wave 5 (higher-degree wave 3) to greater than or equal to 52 sats. Reminder that if the top of higher-degree wave 3 does not make it to at least 52 sats, we could expect our wave 5 to be over-extended.
Once the top of higher-degree wave 3 has been found, we will know whether or not to expect this over-extended wave 5. In the case that higher-degree wave 3 does not surpass 52 sats (and thus under-extended), we then refer to the overall length from the bottom of wave 1 (referred to as wave 0) to the top of wave 3, which has yet to be determined. For the sake of estimating, let's say the top of wave 3 reaches 50 sats. That means that we will use 43 to help us determine where our over-extended wave 5 could end up. When over-extended, wave 5 follows the following criteria: 0.62x wave 0-3, 1x wave 0-3, or 1.62x wave 0-3. Therefore, IF the top of higher-degree wave 3 were to hypothetically reach 50 sats, our over-extended wave 5 could reach the following figures:
keep in mind that the following values are hypothetical. These values will be estimated by using a higher-degree wave 3 reaching 50 sats and reactionary wave 4 correcting down to 37 sats (38.2% retracement of wave 3)
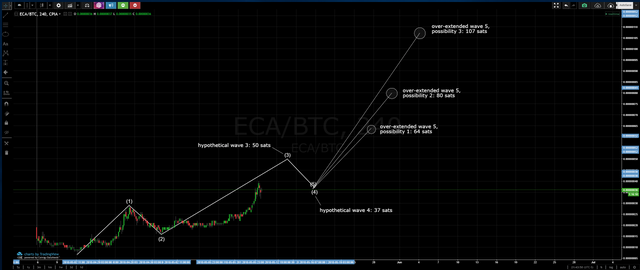
Again: please remember that these figures are inaccurate due to the fact that both the top of wave 3 and the bottom of wave 4 have been fabricated. This is simply to get an idea of what could happen if wave 5 is over-extended. That said, IF these values were correct, and IF wave 5 is over-extended, we could see price hit 64, 80, or 107 sats. The actual value of wave 5 could be in this range of estimates, it could be below this range of estimates, or it could be above this range of estimates. As time moves forward, we will be able to get a better idea of what we could expect to see.
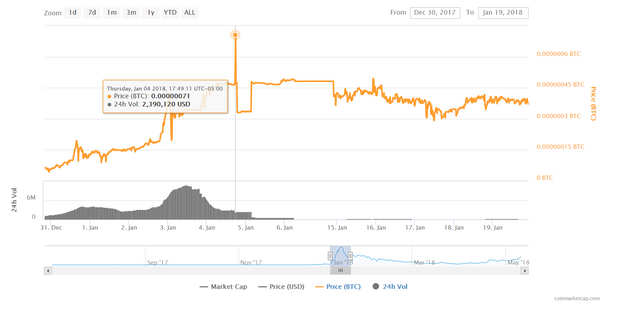
While we're here, let's add one more thing to consider. The charting website I am using only uses the data from Cryptopia and does not include the entire history of Electra. Therefore, I have provided a screenshot from Coin Market Cap:
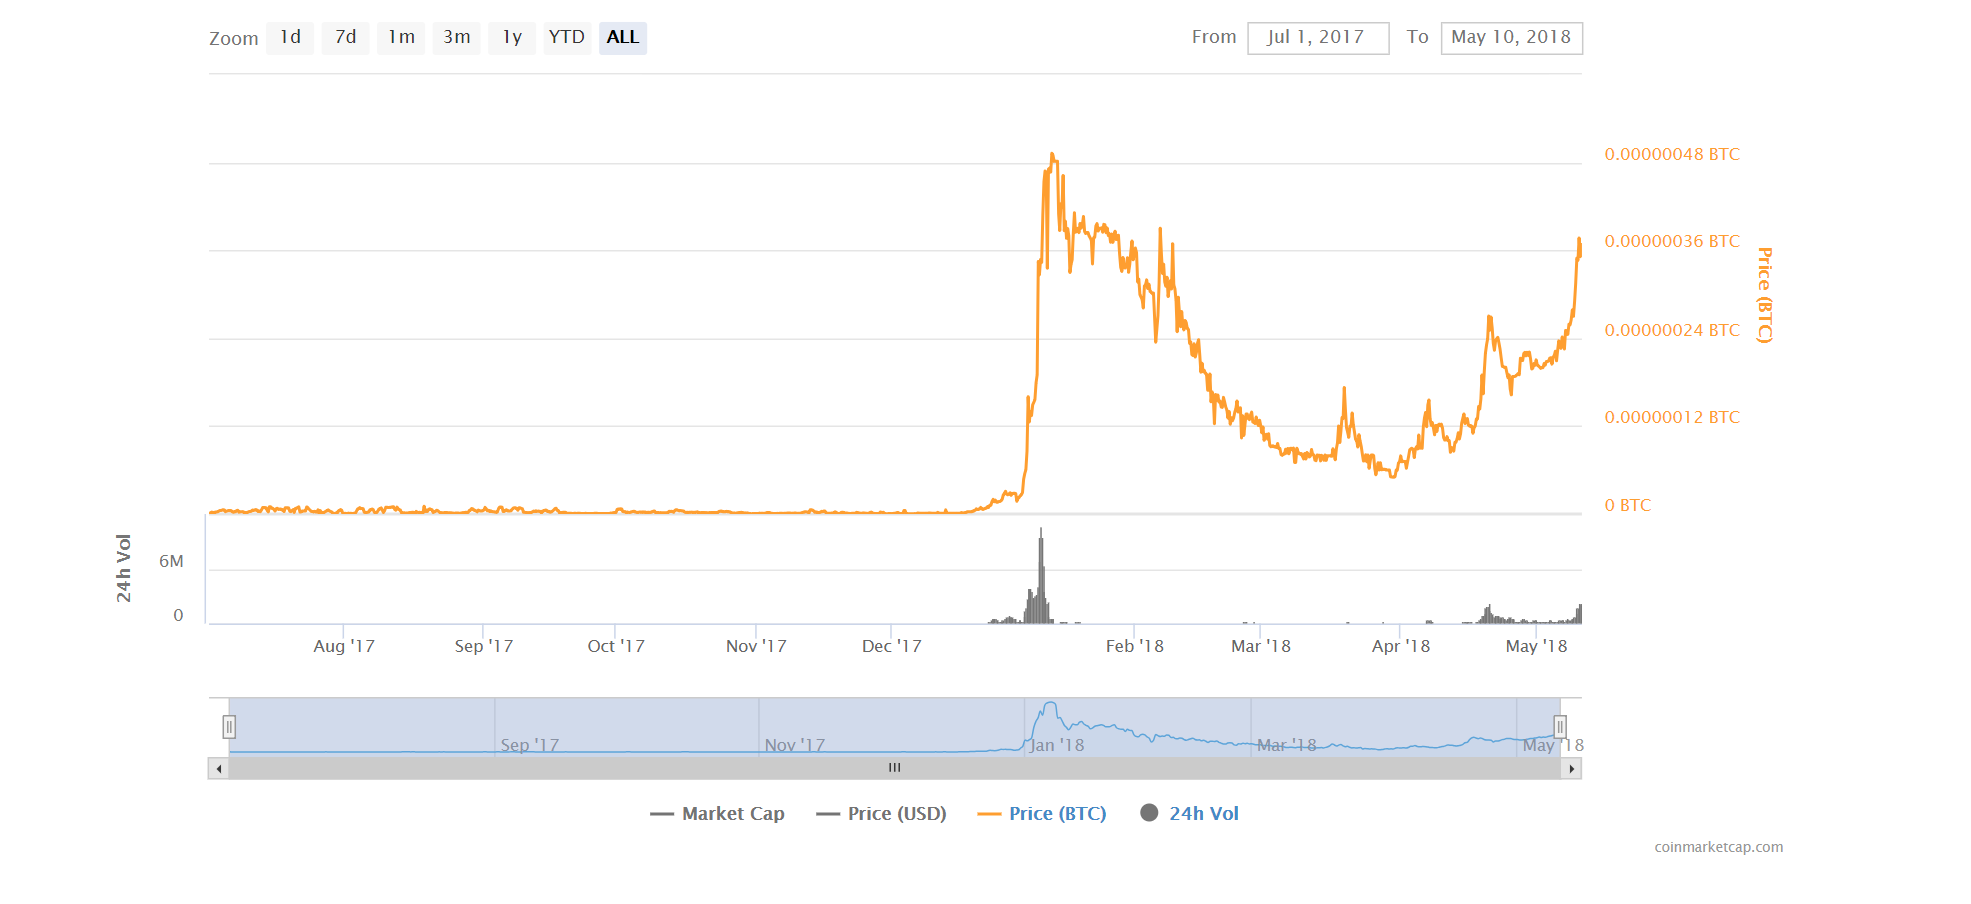
If we zoom into the time that Electra's last all-time high was, we can see that the all-time high was around 71 sats. During this time, the exchange that Electra was listed on was being over-loaded with volume from Electra and eventually shut down for a few months. It is said that the true all time high of Electra is closer to 80 sats, I believe.
When we consider this information, the pieces to the puzzle begin falling into place for me. I hypothesize that the current wave 3 we are on may be under-extended, which means that our wave 5 could be over-extended. This over-extension may bring us to challenge Electra's all-time high. What happens after 5 waves upwards? A reactionary (corrective) wave downwards. I think this correction could complete what is referred to as cup and handle:
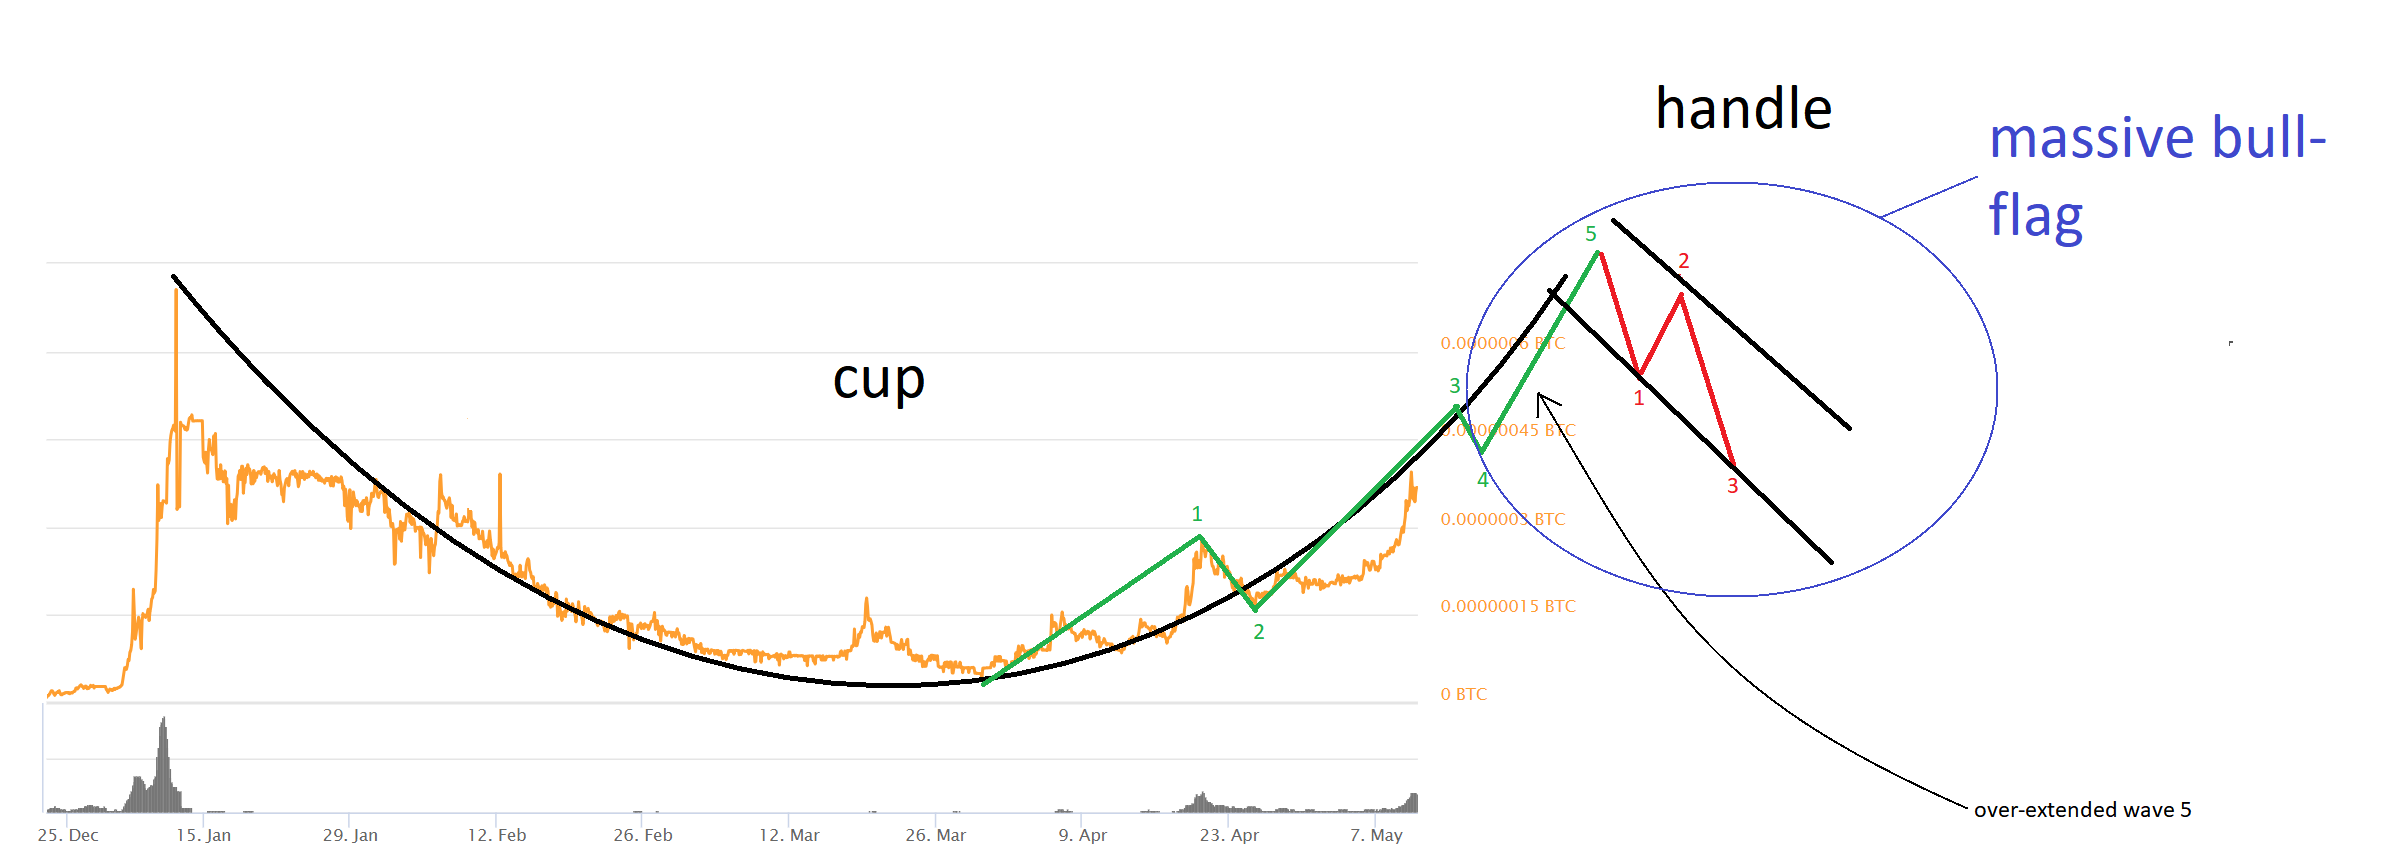
We have a cup with its right edge in the process of being formed. I think the top of the right edge of the cup may challenge Electra's all-time high which at that point may go into a reactionary trend downwards...a correction that may form the handle to the cup and handle AKA a MASSIVE bull flag. After the bottom of the handle has been formed, where do you think we could be going?
I will again say this: the purpose of this analysis is NOT a price prediction. The purpose of this - for me - is to learn. I am learning every day. You know what they say: "practice makes perfect". Although, Technical Analysis is NEVER a crystal ball. Although, how do we learn if we don't try? How do we learn if we don't practice? I hope that by practicing I will do nothing but learn...I hope that those who read this also find some educational benefit from it as well.
Cheers!
Legal Disclaimer: I am not a financial adviser nor is any content in this article presented as financial advice. The information provided in any posts that I make and any accompanying material is for informational purposes only. It should not be considered financial or investment advice of any kind. One should consult with a financial or investment professional to determine what may be best for your individual needs. Plain English: This is only my opinion, make of it what you wish. What does this mean? It means it's not advice nor recommendation to either buy or sell anything! It's only meant for use as informative or entertainment purposes.