Real Trading #4 !!!BITCOIN PRICE FORECAST $2176.25!!!
LTC Opportunity
Hi guys,
Sorry for being MIA for last couple of days. During real trading #3 : https://steemit.com/cryptocurrency/@sososerious/real-trading-3-ltc-breaking I mentioned that I would be looking out for a trade opportunity. Unfortunately, the opportunity did not materialize as trade volume for LTC was low.
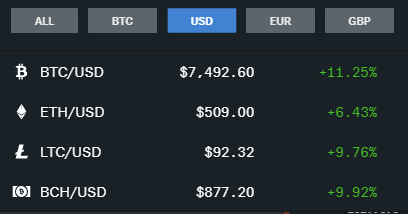
Today BTC is staming ahead!
Also, LTC continues to show signs of a break:
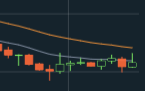
As the grey and orange line (EMA 12 grey EMA 26 orange) move closer to each other, the stronger the chance is for a break in a down slope pattern. When the lines meet, it means that long term and short term weighted averages of the price agree. As they get closer, I will be watching LTC trading patterns. Also, on day over day basis, we begin to see some green candles for LTC . This may be a short term stabilization before downward trend continues. Right now, I suggest to continue watch the market and see if upward patterns emerge for LTC.
BTC PRICE PREDICTION
Talking about patterns.... We all want to know after Bitcoin boom last year, where will BTC price end up and, most importantly, when will another boom happen. To do this, I took BTC monthly price snapshot since 2012 to make some sense of it. As I glanced at the data set, a pattern emerged of a bull market, followed by bear market, followed by a stable period before the cycle repeats:
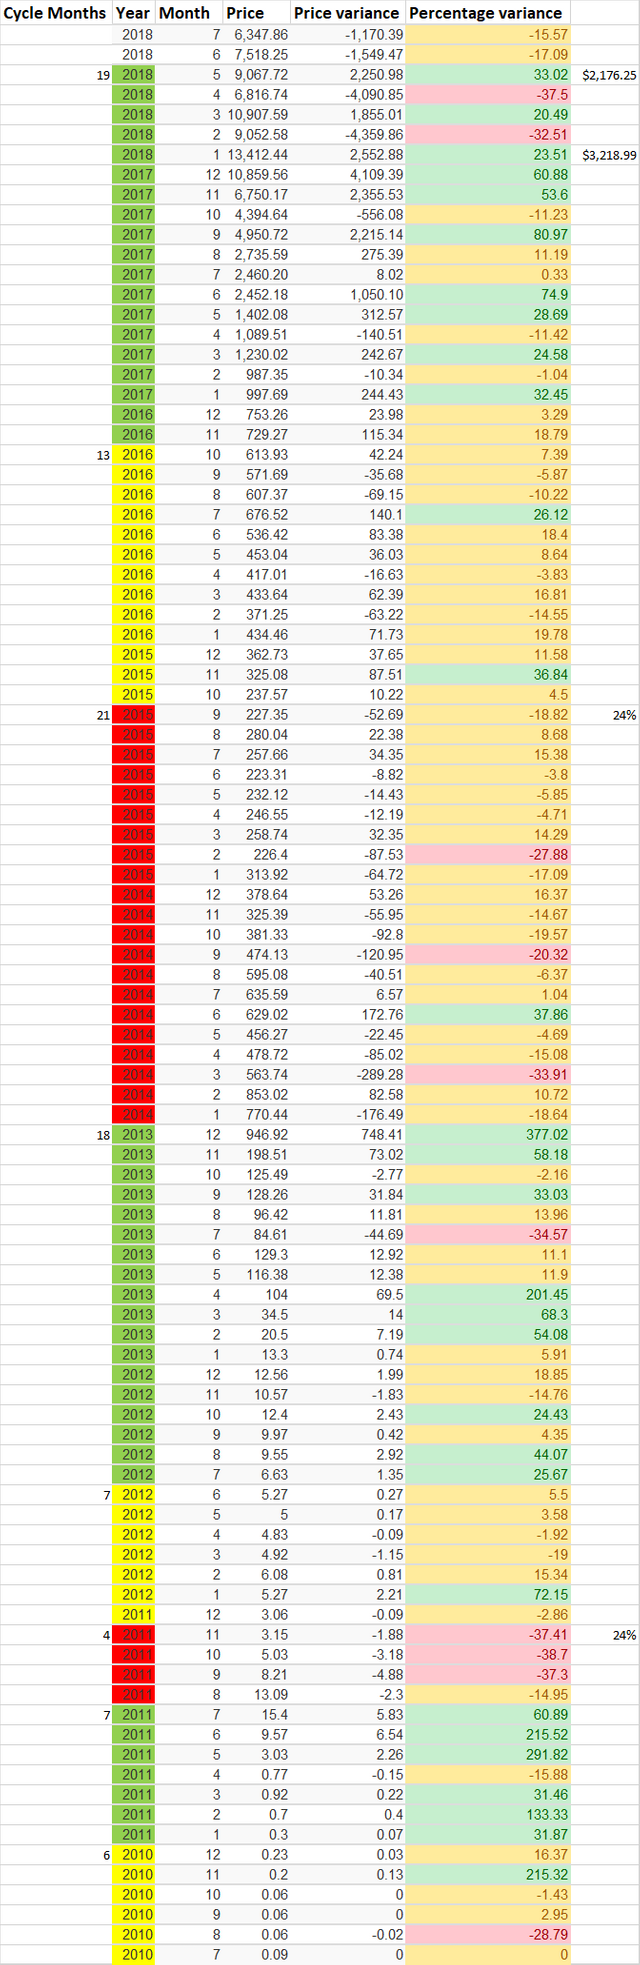
The first column represents how long each trend lasts. For example, last bull market lasted for 19 months. In this column we can roughly see that market heats up over quite a period of time. Last two lasted 18 and 19 months. The market cools down then for a period of time that is roughly double the length of a bull market. So... this means that market will start heating up approximately 2-3 years from now if the pattern persists.
The second column is manually filled in by me. Green is market heating up, red cooling down and yellow is a stable period. To do this, I have mainly relied on month over month price percentage change. There are anomalies in between as there can be a month of deep price drop or increase. However, overall I felt that the pattern remained intact. For the last bull run, an argument can be made that it had ended 4 months earlier. It is up for interpretation, however. In my view, spike in December was unsustainable and simply overpriced. January and February reflected more realistic prices and still demonstrated upward trend comparing to October 2017 and prior months.
Price column represents a price at the beginning of the month. Next two columns compare price variance in dollar amount and percentages. Any price variance within -20% 20% I deemed normal and painted yellow. Price deflation of more than -20% represented in red. Price inflation of over 20% represented in green.
The last unnamed column is the most important column. Based on previous bull markets i have estimated the percent of BTC price of last month of a prolonged deflationary period vs price during last month of a bear market. The result is consistent 24%. This means, if the cycle continues, we will see BTC trading at $3,218.99 if you believe the inflationary period has ended in January and $2,176.25 if you believe the market downturn was more recent. If you see prices hovering around those price points , its a time to buy!
What do you guys think of analysis? Are you going to trade your BTC for LTC?