Major key support is broken
and Bitcoin has a daily close below 34 weeks WMA (white dotted) . Our next target is 0.618 retracement level of the entire move from the low on the 11th of Jan. 2015 to all time high on the 17th of Dec. 2017 ( from $163 to $19704) or $7628 in absolute terms of my data feed. Other exchanges can deviate +/- $50
https://www.mql5.com/en/charts/8254569/btcusd-d1-simplefx-ltd
All major ALTs are following BTC and their targets are on the respective charts.
BCH
https://www.mql5.com/en/charts/8254582/bchusd-d1-simplefx-ltd
DASH
https://www.mql5.com/en/charts/8254603/dash-d1-ava-trade-ltd#
ETH
https://www.mql5.com/en/charts/8254585/ethusd-d1-simplefx-ltd
ETC
https://www.mql5.com/en/charts/8254587/etcusd-d1-simplefx-ltd
LTC
https://www.mql5.com/en/charts/8254591/ltcusd-d1-simplefx-ltd
NEO
https://www.mql5.com/en/charts/8254610/neousd-d1-ava-trade-ltd
XRP
https://www.mql5.com/en/charts/8254596/xrpusd-d1-simplefx-ltd
Once again thanks @srezz !
Bear market it is?
If not, what are the characteristics/signs that you would see to call a bear?
It depends very much on the time frame. Hourly and 4H charts, - yes it's clearly a bear market. But day and weekly charts display merely a correction. The entire crypto universe has gone way ahead of itself and to have a healthy organic growth I'd very much like to see Bitcoin to get back to around $4K.
And where do we go from here...? :)
Crazy market!
Well considering @srezz normally uses xBTCe pricing, I think the target is not met (only 7950 on the dip at xBTCe).
Currently I use SimpleFX for charting and according to their data the lowest point before bouncing was $7599.55
you think we will be going up from there?
I'd expect BTC to at least test 34 weeks WMA (currently @9250) from below.
i think we are still going down to 7600 area
@srezz Thank you so much
Hi Srezz! Thanks for the update. Do you think there are any chances that BTC would go lower than that?
Look here
Thanks!! Now that we touched 7.6k, do you think there will be any chance to dip that low again or lower? Or we will stay around 9k level for a while before shooting up? Many thanks :X
Click here.
And here is even more interesting.
Thanks, really interesting. I hope this is just a temporary thing as always :D
That post 17 days ago proved much closer than much of what was being presented here on Steem by many others since. Good stuff.
As a matter of fact the very first time I tried to warn people of what is in the making on one of the most popular perma bull's blog here, on steemit, 25 days ago.
@srezz the fact that the fall is so sharp does it mean that there is a possiblility for a faster recovery?
Cause for Eth for example it seems that the 880ish support is already broken.
I don't think so. Because it is rather a reaction on the sharp growth. If we use history as a guide it took long 10 months of flat market in 2015 before beginning to recover from the previous drop of the similar magnitude.
There hasn’t even been anything close to a decent bounce yet. Would you be expecting one around that 0.618 fib?
yes
Coins mentioned in post:
Thank you @srezz.
Looking at the past 7d data, can we say that the sharp correction we observed was EW wave 3 and the bounce was wave 4, and last wave will kick in soon? Or should I extend the time frame?
Look forward to learning from you...
The problem with EW is that at any given time it has at least 2 perfectly legitimate wave counts with very different outcomes. It is especially pronounced in corrections. And it can't be otherwise because if it was then the future would be predetermined.
Here is one of my counts:
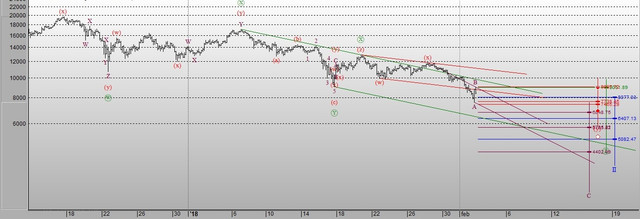
https://ibb.co/f2Hmdm
Thank you very much @srezz!
Everytime I learn something new from your post...