KEEP IT SIMPLE: HOW TO TRADE CRYPTO PROFITABLY IN 15 MINUTES A DAY USING ONLY ONE INDICATOR
When I started trading cryptocurrency, I spent an exorbitant amount of time studying before I ever made my first trade. I studied trading strategies, technical indicators of all kinds, watched countless hours of video content created by other traders who all claimed to have the ‘killer app’, so to speak, for trading crypto profitably. And, at the end of the day, I still lost money. Lots of it.
I think you’d be hard pressed to find a crypto trader who doesn’t have a similar story to mine… they work hard, study hard, and just when they thought they had it figured out, the market reminded them of one invaluable lesson– “past results are not indicative of future gains”.
No matter how experienced you are at trading, or how much money you’ve made in the past, the market can, and will, humble you, sooner or later.
Having been through this experience myself more than once, I started examining my trading strategy to figure out where it was breaking down and causing losses. What I realized was that I was making things too complicated, and, as a result, the predictive value of the individual indicators within my trading strategy were working against each other causing the whole system to break down. I had become a victim of my own experience by combining all of the knowledge I had gained over the past couple of years into one strategy, creating conflicting information that led me to make poor trading decisions at times because of information overload.
So in an effort to reduce my strategy to its simplest form, I decided to conduct a little experiment. I decided to choose a single technical indicator, and to backtest a few of the top cryptocurrencies using that indicator to see if reducing the complexity would produce better trading results based on a single piece of data that I could review in under fifteen minutes a day across all the cryptocurrencies I evaluated, and still make accurate trading calls over a long period of time.
Before I begin, let me tell you what this test DOES NOT do.
- It does NOT help you call tops or bottoms of market moves
- It does NOT tell you how big a move will be
- It does NOT help you predictively, because the indicator I chose is a lagging indicator.
(more on that later)
Now, here’s what this indicator DOES help you do.
- It helps you avoid FOMO trading
- It helps you sleep at night
- It gives you a long term strategy for consistent growth
- It helps reduce confusion about why a market moved the direction it did or didn’t.
- It cuts down the time needed for trading DRAMATICALLY.
- It gives RELIABLE and ACTIONABLE data points.
So, now for the moment you’ve been waiting for… can I get a DRUMROLL please!
The indicator I chose to use for my trading strategy IS the SIMPLE MOVING AVERAGE.
(I know, I know. You’re thinking to yourself right now, “this is a huge waste of time.” But hear me out.)
I chose to use a combination of 2 simple moving averages, set to the 50 period and 200 period time frames, and I use them on a 4 hour candle chart. The reason I chose these this specific 50/200 configuration for the 2 SMAs is that these time frames are fairly standard fare for most traders, and therefore are actionable by a LOT of traders. I chose the 4h candles because that gives enough data to trade actively, without causing overtrading, which can happen when using this indicator on 1h or smaller candles. It would still work, but it would be much choppier, which isn’t really in line with my personal trading style. But hey, you do you, boo.
As many of you probably know already, the reason why indicators work is because they become self-fulfilling prophecies. Once an indicator becomes popular, traders all start acting on it in unison, which, in the case of a buy indicator, causes demand to increase as traders take action on it pushing price up with the volume increase. Conversely, a sell indicator pushes price down for the simple reason that many traders act on that same information and sell simultaneously causing the sell-off.
In the case of the 50/200 SMA, there are two specific points that I’m interested in.
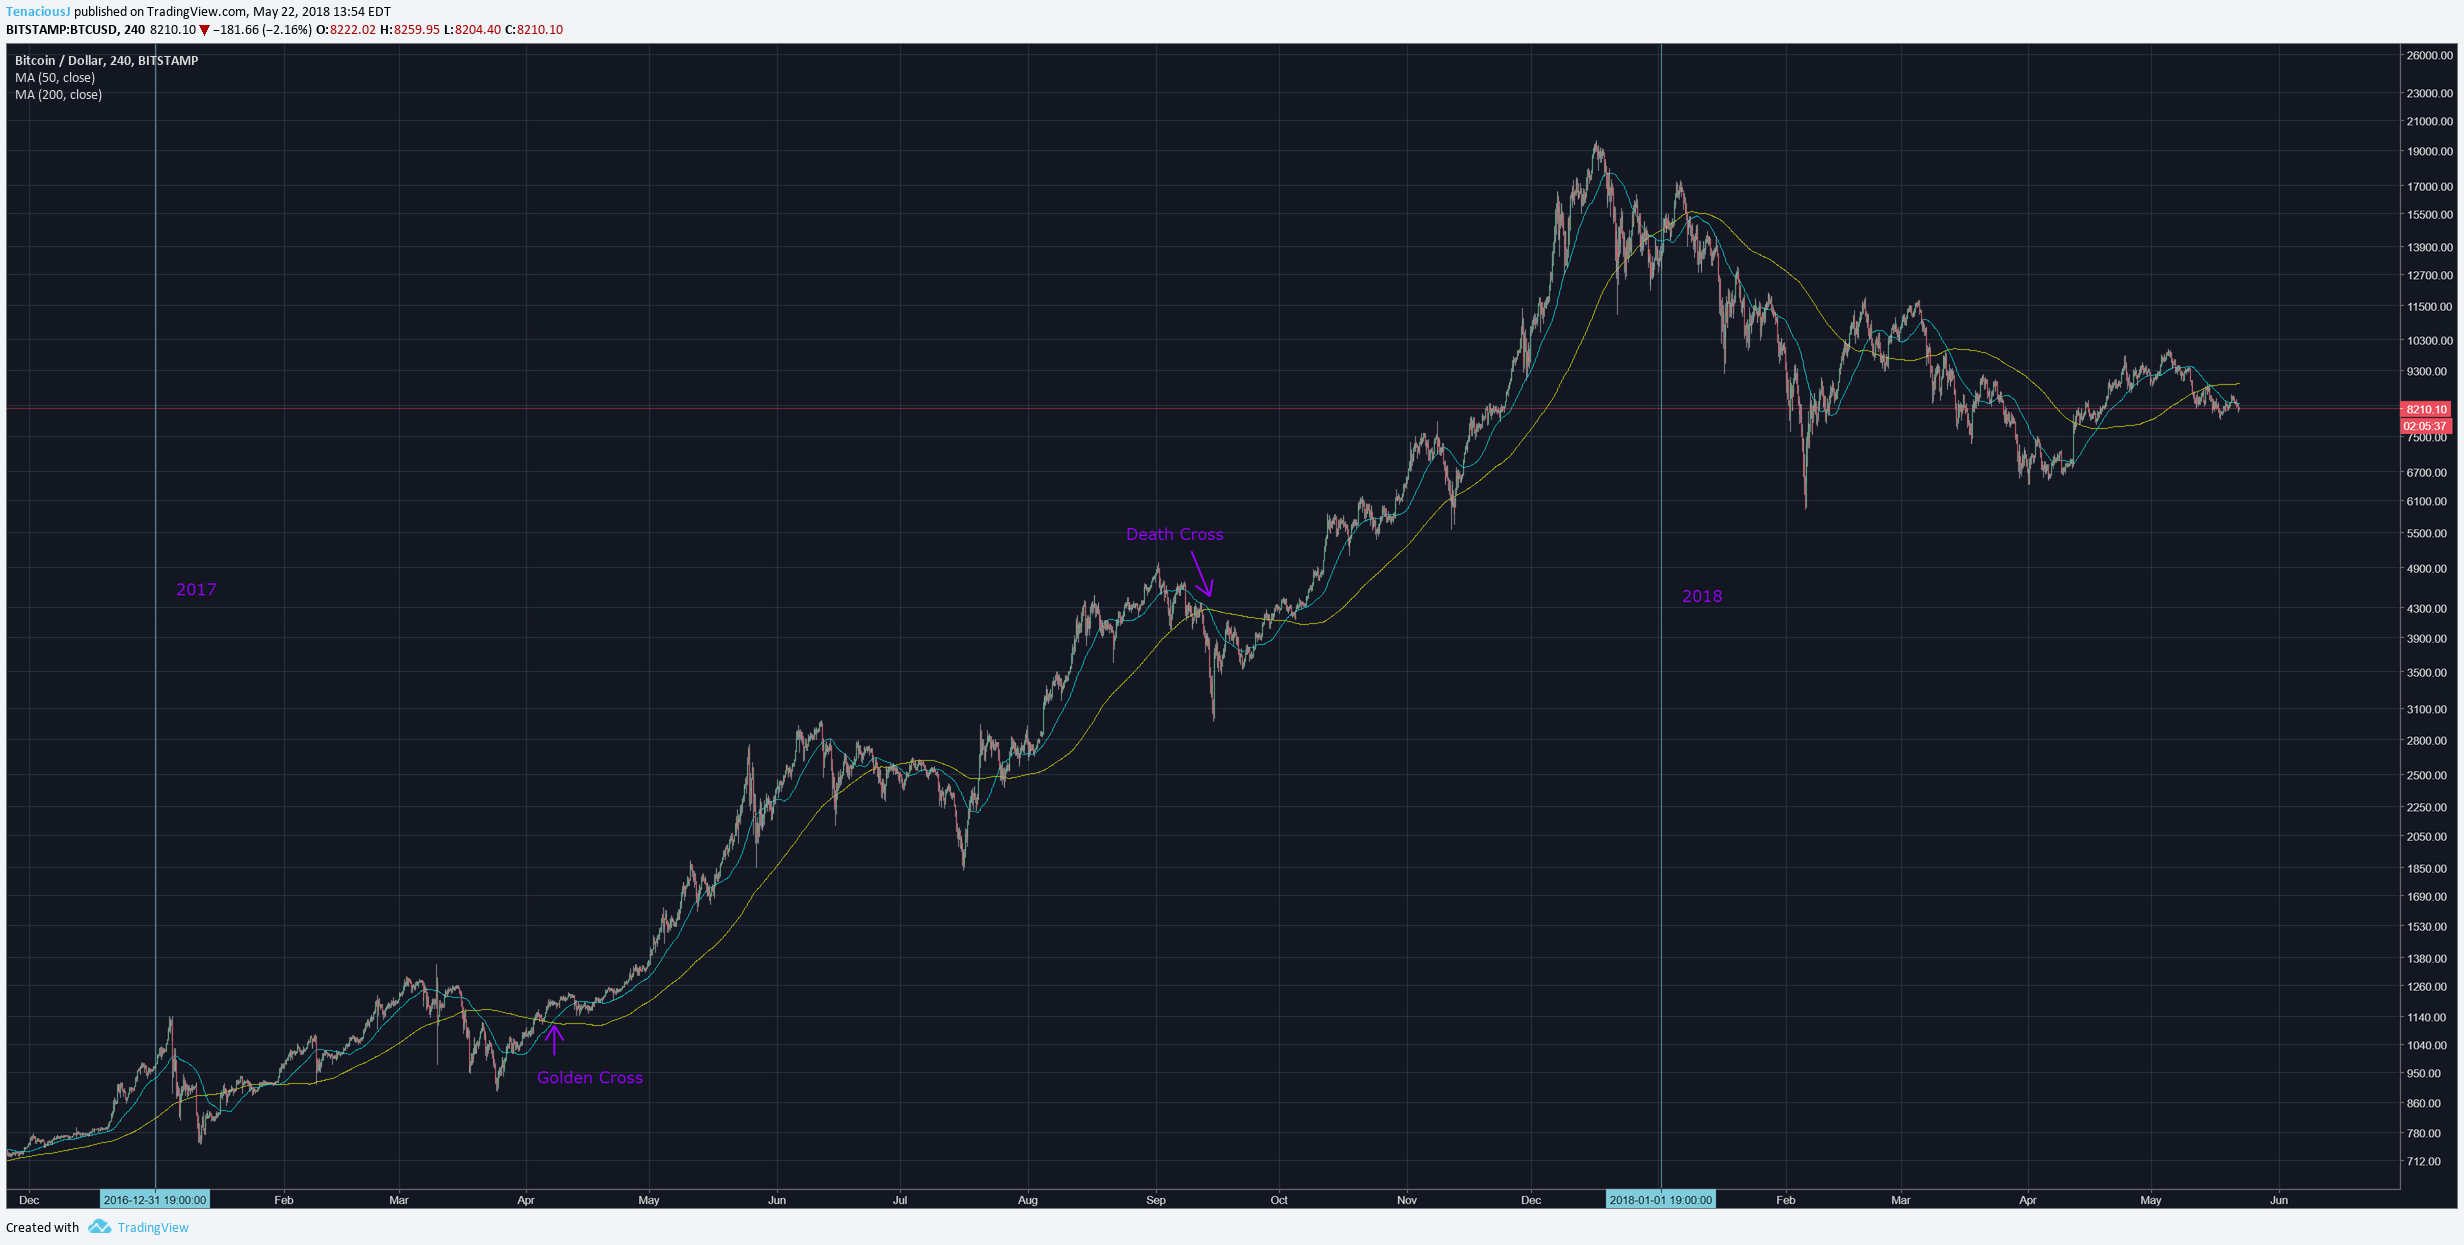
The first is the “Golden Cross”, which is a name given to the point when the 50 period MA moves up across the 200 period MA. This is a lagging indicator of a momentum reversal, and is typically indicative of sustained buying pressure. As a result, many traders will use this price point to buy in, further reinforcing the value it has as a reliable trading point.
The second data point, contrarily called the “Death Cross”, occurs when the opposite conditions are true – the 50 period MA moves back below the 200 period MA. Again, this is an indicator used by many traders as an exit point for positions, making it an important strategic trading point.
(I guess steem doesn't allow you to click on an image to blow it up larger, but if you CTRL+ALT+mouse wheel, you can make it more visible)
As they say, the devil’s in the details… so without further ado, let’s get down into the weeds.
FIRST UP: BITCOIN
The granddaddy of all cryptos, Bitcoin is by far the most liquid market with the most data, so it’s an obvious starting point for this research.
I chose April 24, 2013 as the start date, because that is the first date we saw a golden cross buy signal in Bitcoin on the Bitstamp exchange, which I am using because it has the most data available. It’s also right before the extended bear market which I wanted to test against this strategy to see how it works in both bear and bull markets.
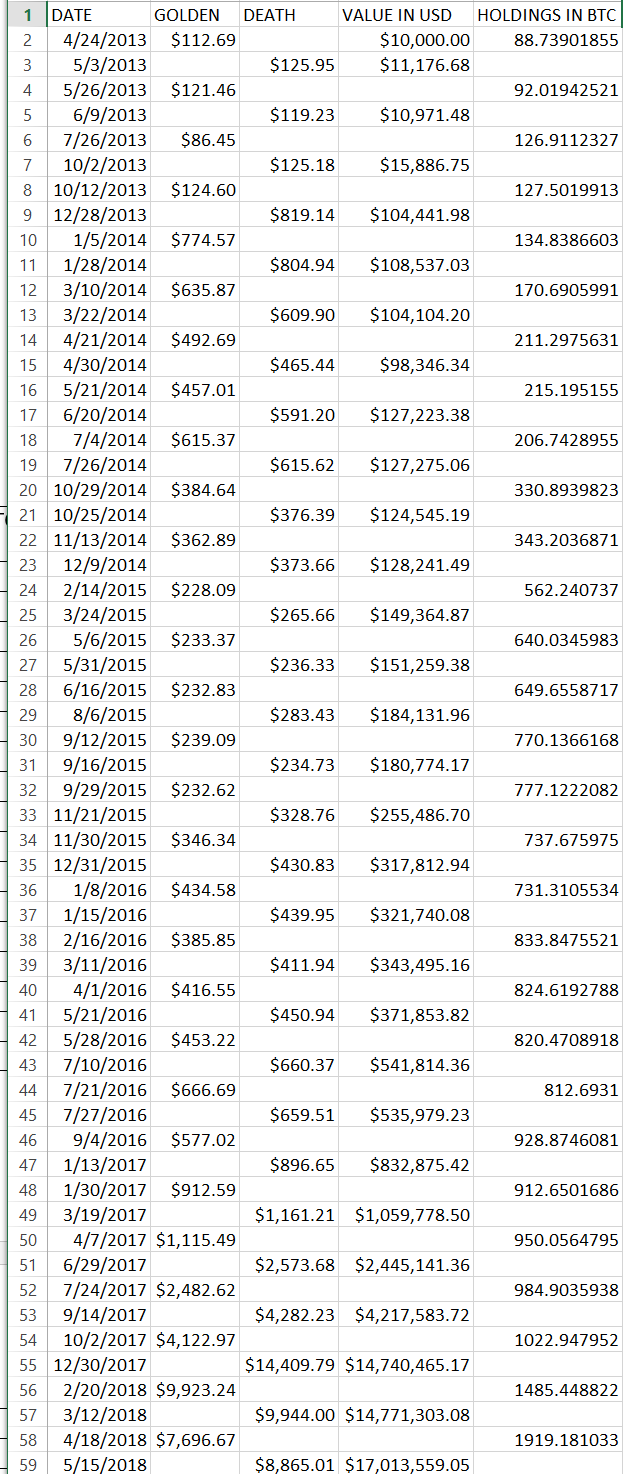
For control, I will analyze each currency with a starting investment of $10,000 USD, and will buy every time a golden cross occurs, and sell every time a death cross occurs on the 4h chart without exception. The reference data includes the buy and sell price of each action taken, and also the USD value when holding dollars, and the crypto value when in an active trade.
SUMMARY OF RESULTS:
First Trade Date: 4/24/2013
Total Trades: 58
Losing Trades: 5 (8.62% of total trades)
Success Rate: 91.38%
Starting Value: $10,000 / 88.73901855 BTC @ $112.69 Each
Ending Value: $17,013,559.05 / 1,919.18103307 BTC @ $8,865.01
Last Trade Date: 5/15/2018
Time Elapsed: ~ 5 years 3 weeks
ROI: 1,701x return
HODL Comparison: 88.73901855 BTC @ $8,865.01 = $786,672.29
ROI vs. HODL: 21.627x better returns trading this strategy
REFERENCE DATA:
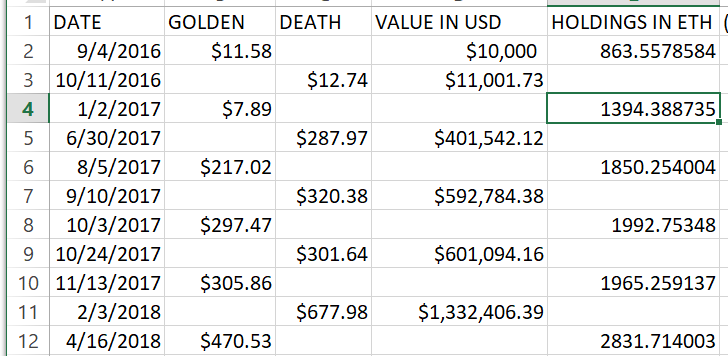
SECOND: ETHEREUM
The same parameters apply to Ethereum as I used for Bitcoin above… $10,000 starting investment beginning with the first golden cross in the available data. For Ethereum, I chose to use data from Bitfinex, which goes back to June 2016. Much less data than Bitcoin, but still significant enough to provide several data points to analyze.
SUMMARY OF ETHEREUM:
First Trade Date: 9/4/2016
Total Trades: 11
Losing Trades: 0
Success Rate: 100%
Starting Value: $10,000 / 863.5578584 ETH @ $11.58 Each
Ending Value: $1,918,769.41 / 2831.714003 ETH @ $677.70 (as of 5/18, trade still active)
Last Trade Date: 4/16/2018
Time Elapsed: ~ 1 years 7 months 2 weeks
ROI: 191.88x return
HODL Comparison: 863.5578584 ETH @ $677.70 = $585,233.16
ROI vs. HODL: 3.28x better returns trading this strategy
REFERENCE DATA:
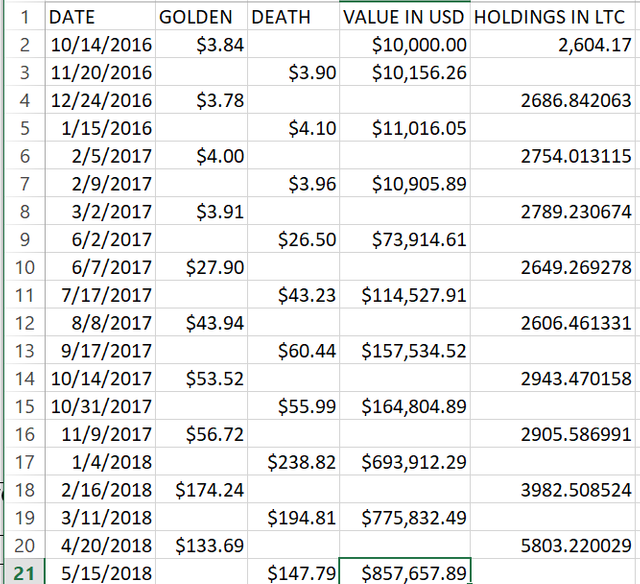
THIRD: LITECOIN
Same parameters as above, all data pulled from Coinbase which has data as far back as August 2016.
SUMMARY OF LITECOIN:
First Trade Date: 10/14/2016
Total Trades: 20
Losing Trades: 1
Success Rate: 95%
Starting Value: $10,000 / 2,604.17 LTC @ $3.84 Each
Ending Value: $857,657.89 / 5,803.22 LTC @ $147.79
Last Trade Date: 5/15/2018
Time Elapsed: ~ 1 years 7 months
ROI: 85.77x return
HODL Comparison: 2,604.17 LTC @ $147.79 = $384,870.28
ROI vs. HODL: 2.23x better returns trading this strategy
CONCLUSION:
There are many other coins worthy of consideration, but I limited this experiment to those with USD pairs and substantial trading histories to avoid outliers and statistical anomalies. That being said, I am convinced that this method will prove very rewarding over time with any currency vs. simply HODLing or trading multiple indicators that can lead to overtrading.
WARNING:
This method will NOT help you sell at the top of the market or buy at the bottom, maybe not even that close, but what it WILL do is help you take advantage of downtrends and uptrends in the market while maintaining substantial risk management. Failure to implement proper risk management is why most traders end up losing money overall, because they try to ride out trends that are going against them. I’ve done it myself, so I speak from experience.
Trading isn’t easy, otherwise everyone would be rich. So I hope that this research helps you become a better, more profitable trader; and to hold onto your gains once you make them. As my trading Sensei told me, when you find something that works, shout it from the rooftops, because the more people that follow a strategy, the more effective it becomes. This makes perfect sense when you consider my prior discussion of the self-fulfilling prophecy of technical indicators. The more players that adhere to the same rules, the more profitable those who play by those rules become.
GOOD LUCK AND HAPPY TRADING!
TenaciousJ
P.S. If you found this useful, maybe consider throwing an upvote on it. It will help others find the information they’re looking for, and in the end that benefits the trading community as a whole.
As always, I welcome comments and thoughts on my posts, as they help me think critically and constructively about my ideas, which helps me refine them.
nice
Congratulations @tenaciousj! You received a personal award!
You can view your badges on your Steem Board and compare to others on the Steem Ranking
Do not miss the last post from @steemitboard:
Vote for @Steemitboard as a witness to get one more award and increased upvotes!