Tron,stellar, tether, vechain daily chart analysis blog #1 daily analysis series
hello friends ,
After posting comeback video which is very bad i know.
its time come at the point and do some analysis which is quite simple not hi fi
In this blog i am going to do analysis of TRON STELLAR RIPPLE 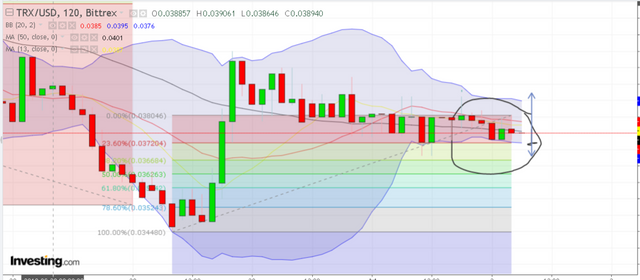
1.Tron/usd
This is the todays 2 hour chart as you can see in this chart the price is back down after touching the level $ .038 in last 6 hours after that but if its going down at $ .037 there is strong support but breakout is possible more chance of upside and the touching the level of $0.4 so now enjoy your trades i wish get big profit thanks.
2.Stellar/usd
See this daily chart here 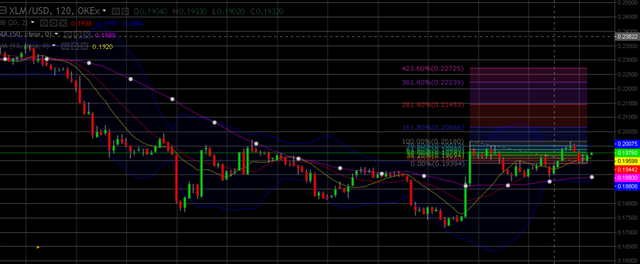
As you can see in this there is big upside move in the start in last few hour it broked the fib level 23.6 and important resistance $ .0195 there is strong resistance at 68 fib level which we can see and almost $.02000 which is tested in previous days we this time it broke this the big upside gain in this coin. there is strong chance to get upside so wait and watch. Enjoy the trade in this i hope you got a huge profit.
- Tether/usd
See the daily chart here 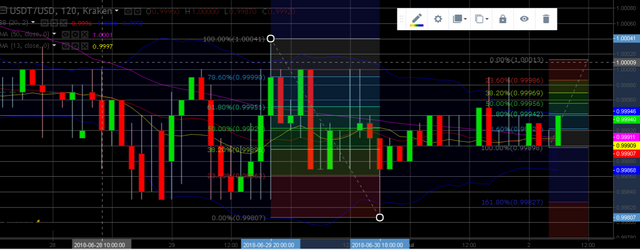
The coin is upgain after forming a plus sign after the red candle which also know as bull sign so now come to the point it is touched the level of 61.8 strong resistance level at the price $.999 but if there is upside breakout which is precisely
possible then we see the level of $1 . Enjoy Enjoy Enjoy gain profit and bless to god this coin is break the level of $1 .
- Vechain/Usd
See the daily chart here
Vechain is currently at the price level $2.5 and there is strong resistance that $2.63 if it this broke out this level we will see the level of $2.7 but there breakout is possible big chance to downside at the level of $2.4 enjoy enjoy enjoy.
Today next blog topic bitcoin price down exact not fundamentally not technical chart only thins which we will not seen generally i helped you to see this and understand this.
Note - money is yours risk is yours . profit and decision is yours. this is only for entertainment purpose.
Today next blog topic bitcoin price down exact not fundamentally not technical chart only thins which we will not seen generally i helped you to see this and understand this.