Tron,stellar, tether, vechain daily chart analysis blog #2 daily analysis series
hello friends,
so this is the chart of yesterday
1Trx/usd
*tron chart *
this is the today chart
**So now after touching the price level of $.041 fib level almost 23.6 level which became strong resistance we see downfall after that but 100 day sma indicates that price should goes up in next some hours but it is still under the 200 day sma which is quietly indicates that price should be down under $.045b so in upgai case the price level $.0408 is strong resistance but breakout is possible indicates stochastic indicator in the previous some good thing happen in the crypto market so we will seen bitcoin effect in some days **
2.XLM/USD
**This is the yesterday chart of stellar **
**This is the today charts **
So the finally XLM rose above the 20 day sma which is likely to be show that upside gain another thing that we should in my mind $.23 is Fib level 23.6%strong resistance which is likely is to touch in future but the the stochastic indicates show that it should be in sold zone we will need to see well if this price level broke we see log gain in this coin so upside breakout is more possible I wish you to gain massive profit.
3.TETHER/USD
This is the yesterday chart
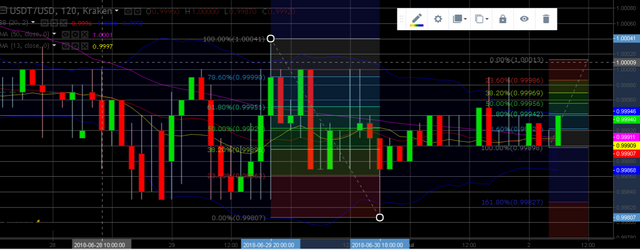
**As i say in the yesterday analysis we should see the price level of $1 well it also touched but suddenly down at 100% Fib level but upgain is started now we will strong suppoRt $.992 at Fib level but this is still under the 20 day sma 200 day sma which indicates it takes time to touch $1 in near future i mean in this month it should also happen in less time because some good things happen in the crypto market Rsi indicates upside gain but we will need to be breakout so wait and watch **
4.Ven/usd
This is the today chart
**As i say in yesterday we will the price level of $2.7 which is happen even its het gain at the price level $2.9 so now After touching the level $2.9 it start down side obviously which happen because there is strong resistance which indicated by the Rsi at the time Usdt at $2.78 level if the price fall from there is good support at price level it is still upside from 100 day sma well my yesterday predication became we will see the downside **
Note - this is only for educational purpose.risk is yours. money is your decisions is yours.
bye bye