An example of an "equilateral triangle" pattern on a BTS / BTC pair chart.

Hi, Steemians…
In the last posts, the name of the pattern - "an equilateral triangle lying on its side" was often encountered. Probably there is another name for it, but it will be clearer. It appears in cases where the market can not decide where in the future the price of the asset will go.
A good example of this pattern is the current BTS chart on its pair with BTC.
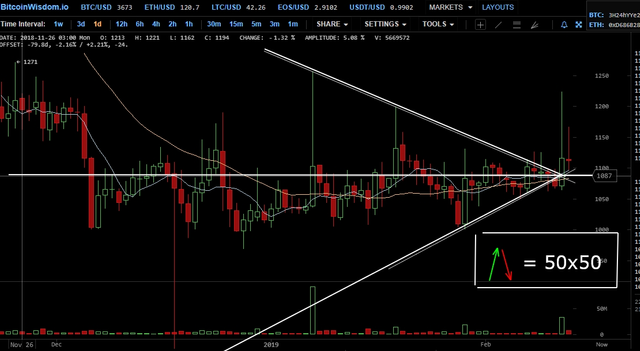
I am not saying that the angles of this triangle should coincide to a degree. Enough is about the same.
Due to the strong volatility of the Bitcoin price, we will see such pictures more than once. But in the near future, its price should stabilize and we will hardly meet such patterns.
And as a result - do not rush to buy an asset if it is under the influence of this pattern. As well as you should not part with this asset, if you already have it.
Over the past year, due to a sharp drop in the price of BTC, the trading turnovers of all the exchanges have dropped significantly. The market needs fresh blood in the form of new investors. With their arrival, trade will increase significantly, but their appearance is directly related to the price of BTC. The lower it is, the more attractive it is for new investors. Everyone is interested in reviving the market - investors, ordinary traders and moneybags - puppeteers.
We wait.
Thank you for reading and support!
Good luck!
*The @upvoteinvest team
A formal disclaimer
Some of the posts might contain our opinion on trading strategies based on our technical and fundamental knowledge. However, please, invest at your own risk. We can’t be held responsible for any losses.