Immediate perspective EOS / BTC. The probability of falling prices. Support levels

Hi, friends!!
Most of the Altcoins, which rose in price after Bitcoin, begin their decline.
Consider EOS / BTC. Biitfinex Exchange, 12 hour timeframe
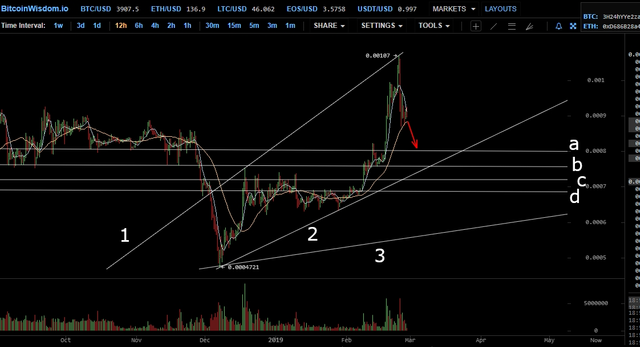
The following lines are marked on this exchange chart:
__ 1, 2 - boundaries of the ascending corridor, within which the price of the asset will be in the coming month.
3 - The main bullish support line, the general uptrend line.
Support price levels:
a - 0.0008BTC
b - 0.00076BTC
c - 0.00072BTC
d - 0.00069BTC
This chart shows that the asset price rate ends up drawing a classic pattern - “head with shoulders”. This pattern means falling prices. Based on it, I can assume that in the near future the price of the asset will fall to the level of support (a )(0.0008BTC). From this line, the price should bounce up, but not much. Then the fall should continue.
I deliberately did not draw an approximate price movement pattern, as this will depend on many factors, including the hype.
For the EOS market, the main thing is not to break the lower line of the corridor (2). Therefore, all the main price movement in the coming month will occur within 0.00076-0.0008 + BTC. If a breakdown of line 2 occurs within the next month, the asset price may fall much more significantly, up to the main support line 3.
EOS / BTC large trade turnovers will appear by mid-March, when the price reaches the line 2. How the market at this border behaves is not yet known.
Good luck!
The @upvoteinvest team
A formal disclaimer
Some of the posts might contain our opinion on trading strategies based on our technical and fundamental knowledge. However, please, invest at your own risk. We can’t be held responsible for any losses.