The total stock chart of RIPPLE in the weekly timeframe. Growth will not be until July

The price of an asset moves in a narrowing triangle from January 2018. Great volatility disappeared. Now the coin is in a stable state of consolidation of funds. If we start with the rule of specularity of stock charts, then in the second half of March the price will fall and rebound to the top. But all this is within the limits of the triangle.
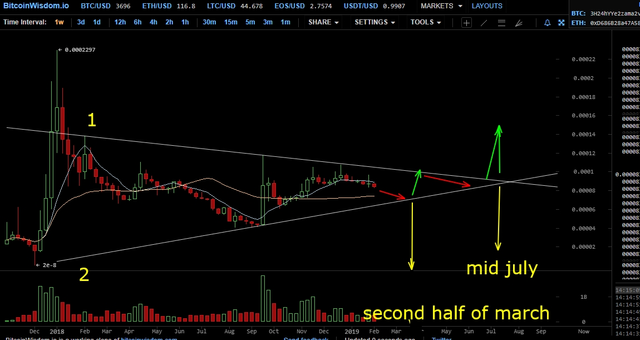
I want to remind that the stock charts of many altcoins also indicate a rise in prices at the end of this summer.
Thank you for reading and support!
Good luck!
The @upvoteinvest team
A formal disclaimer
Some of the posts might contain our opinion on trading strategies based on our technical and fundamental knowledge. However, please, invest at your own risk. We can’t be held responsible for any losses.