Financial (and crypto) Bubbles
Like most things in finance, a bubble is hard to define, and even harder to recognize. While we can’t help you predict the next big market booms and crashes, we can give you more information that may help you make better decisions. This week, we’re focusing on bubbles — what they are, what they look like, and whether or not crypto, as an asset class, is in the middle of one.
What is a bubble?
Despite how many people have only heard the term “bubble” used in the context of cryptocurrencies, the concept has its roots in traditional finance. An exact definition, however, is hard to pin down. Some analysts rely on the speed at which an asset increases and then decreases in price; some rely on the nominal value outstripping the fundamental value; still others focus on investor psychology. The truth is likely some combination of all three: a good working definition may be something like, “A bubble occurs when traders irrationally drive the price of an asset up so rapidly that the cost is significantly higher than a fundamental analysis would warrant”. This leads to volatility, and more often than not, a crash — the bubble ‘popping’.
What does a bubble look like?
You’re probably fairly familiar with this chart, but it’s a great illustration:
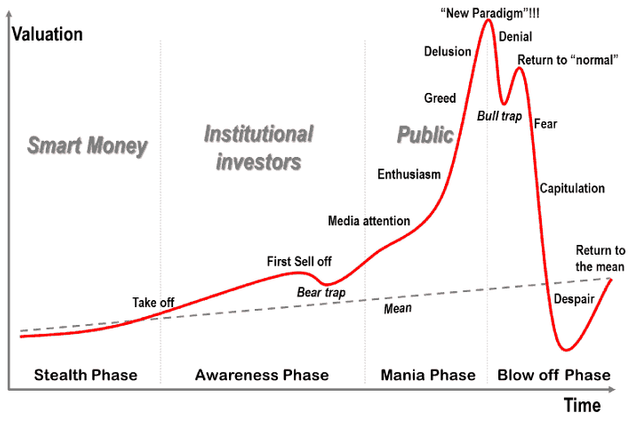
The labels are well-done and fairly self explanatory — here, we’ll focus primarily on the “mania” phase. In short, a bubble looks irrational. What we see (and can recognize after the fact) is that much of the price rise was due to a Fear of Missing Out (FOMO) mindset. This can drive the prices up, and will keep investors buying in at high prices so as to not let huge gains pass them by. Also noteworthy is the idea that these gains are driven by a willful ignorance of the facts:
Bubbles often bring along a “this time is different” mindset, which both causes traders to ignore the warning signs, and keeps them buying high and selling low
The difficult part of determining whether an asset is in a bubble is distinguishing between an “irrational” rise in price, implying that a crash may be coming, and a rational rise — legitimate bull markets, markets able to absorb and reflect changing risk tolerances, or a myriad of other things can resemble a bubble, and signal something besides an impending implosion.
What to do if you suspect a bubble?
Well, the first thing to remember is that bubbles are only identifiable retroactively — there’s no real way to know that an asset is (or was) in a bubble until it’s too late! Therefore, the only rational first step is to take a step back and reconsider where the bubble fears are coming from. Are they coming from other novice traders? A few fear-mongering news outlets? These are relatively unreliable sources, and ought to be listened to selectively, if at all.
But perhaps you’re convinced that an asset you’ve invested in is due for a major correction, if not a complete pop. The two things to keep in mind are that a) the decline will be sharp and unexpected; and b) risk management is key. The best play is to average yourself out of the market.
Nobody knows when a bubble will pop, and there are possibly still significant gains to be made — until there aren’t, of course.
By averaging yourself out of the market, you’re protecting increasing amounts of your profits, while still leaving room for some of your positions to increase (while simultaneously hedging against a refreshed bull run). You will miss out on some profits, but this is infinitely better than trying to time the market all the way to the top. As a bonus, if the market drops before you’re averaged entirely out, your losses will be much less than if you had tried to guess the top, and missed. Beating the market in a bubble is all about downside risk management, and this is your best shot as a positive outcome. A great shot at a really good profit is, in my book, leagues better than a low shot at a great outcome.
Is Crypto in a bubble?
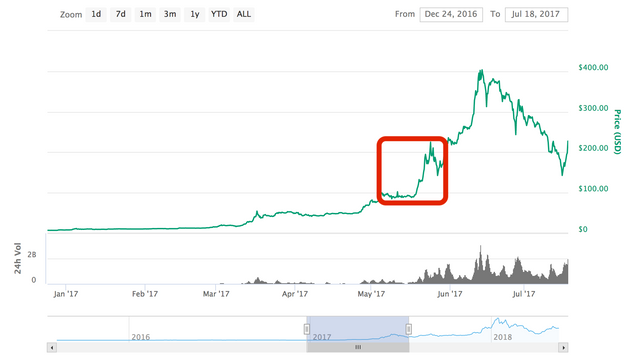
This is the million-dollar question — literally. The truth is, nobody really knows. All we can do is engage in the flawed activity of chart comparison and… well, fortune telling. Why is this flawed? Well, to find out, let’s take a look at some Ethereum charts at various points throughout history and see how closely they match the “bubble chart” above (all charts taken from coinmarketcap.com). We can start with this one, which we’ll call Chart A:
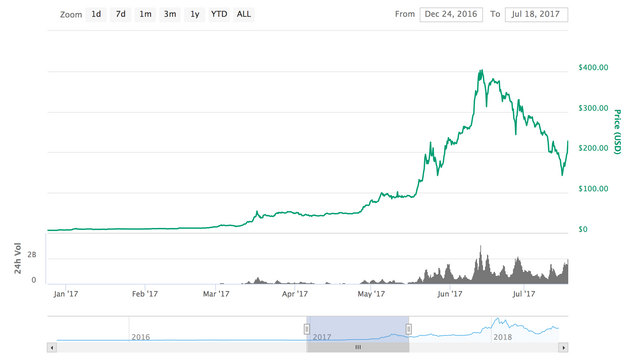
Just initially, there’s a pretty strong resemblance here. A reasonable person could look at this and see a classic bubble:
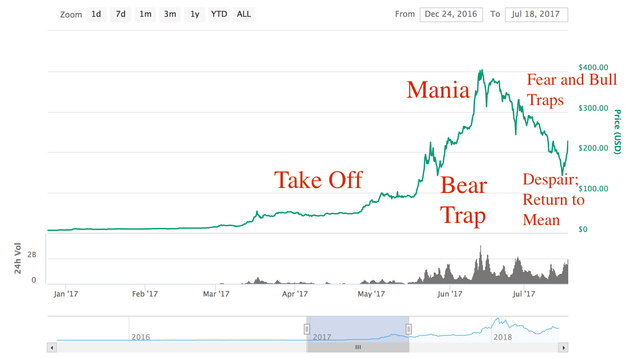
But here’s the thing: take a look at the dates. Dec 24, 2016 — July 18, 2017. That’s only a 7-month span. Even more interesting, we can zoom in even further — to May 5th through May 27th — and see what really could be another bubble, complete with the same patterns and markers:
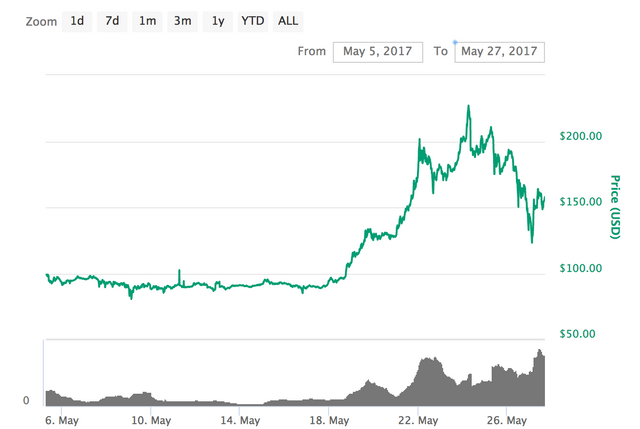
If you removed the time and price markers, either of these could show the greatest financial bubble in human history — it’s entirely scale-dependent. This should illustrate a few things. One, it should highlight the fact that technical analysis, especially when dealing with macro events, is as much art as it is science. But more importantly, it should really drive home the point that financial charts are like statistics in the sense that it’s incredibly easy to make them say whatever you want them to say. This ties into a third takeaway: true analysis is only possible retrospectively.
What might look like a bubble in the moment can easily be a whole lot of nothing in the grand scheme of things.
Notice one thing about the “official” bubble diagram I pasted in above: there are zero — zero — temporal or price points of reference. Just a time arrow, moving forward, and a price axis. Does that process take place over the course of a day? A month? A year? Multiple millennia? And what about price, did this asset shoot up from $1 to $6, or from $10 to seventeen trillion dollars? We have no way of knowing.
Let’s return to the Ethereum charts. What we have should make you really cautious about analyzing the present, or even the recent past. First, we have this (potential) bubble, found in the chart from May 5th, 2017—May 27, 2017:

This, when scaled to look like the present, sure looks like a bubble. However, with a little perspective, we see that the “bubble” is really just the “bear trap” phase of Chart A!
And, to further complicate things, Chart A is only one small part of the entire history of Ethereum. If we zoom all the way out, even Chart A is only what could easily be the bear trap in the bird’s-eye view since the genesis block!
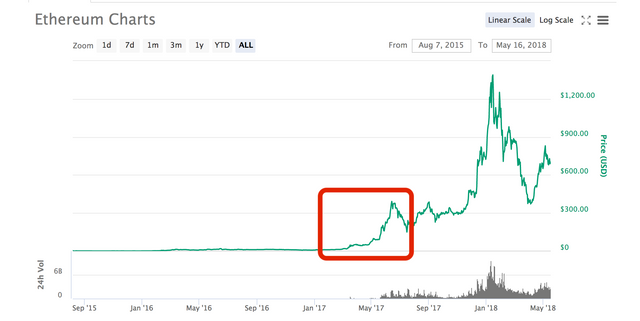
The astute reader may notice that the macro Ethereum chart looks like a bubble, and that’s a legitimate observation. All the pieces are there, and we can label the various components with reasonable certainty. In fact, it’s possibly the view that most closely resembles the prototypical bubble:
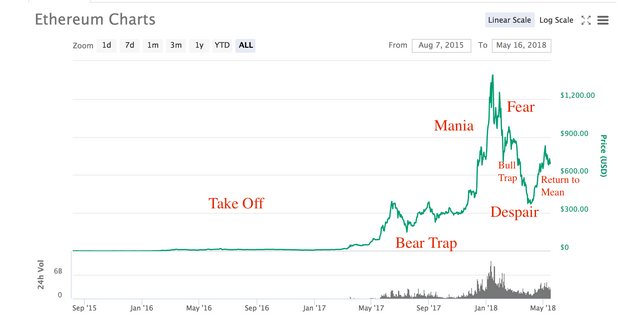
Is this actually a bubble, the kind that pops and never recovers, or returns to the mean before beginning a painfully slow climb back to historical levels? We may not know until it’s too late. This chart could easily show the growing pains of an industry, with all-time highs just a memory that we won’t return to for years, if ever — or it could just be showing the awareness phase. What might look like a popping bubble now may, in retrospect, simply be a blip on the radar. Just as the “micro bubble” view of Chart A ended up, in retrospect, being something closer to a bear trap; and the “bubble” shown in Chart A is clearly, if anything, just the bear trap of the current macro view of Ethereum… what looks like a bubble now may be just the bear trap of the coming revolution. Or, of course, crypto could be just coming out of an actual bubble, and we’re officially in for another crypto winter. Either is possible, but it’s only able to be determined with context and perspective.
Given this uncertainty, the best things to keep in mind are that the markets are irrational, smart investing is all about risk management, and above all, nobody knows the future. Be wary of people who claim to have all the answers—as unlikely as that is just generally, it’s especially unlikely in crypto. Only hindsight will tell us if we are truly in a bubble, but good strategies are time-tested and offer the best chance at a positive outcome.
Good luck out there. Stay safe. And remember to keep some perspective!
Hi! This is jlk.news intelligent bot. I just upvoted your post based on my criterias for quality. Keep on writing nice posts on Steemit and follow me @jlkreiss to get premium world news updates round the clock! 🦄🦄🦄
Congratulations @vevaone! You received a personal award!
You can view your badges on your Steem Board and compare to others on the Steem Ranking
Vote for @Steemitboard as a witness to get one more award and increased upvotes!