Bitcoin Technical Analysis: BREAKOUT...NOW WHAT?
Yesterday I discussed a larger move may be coming. This morning we saw price jump about $260. It found resistance right at $6,540. This is the top of the range price has done the majority of it's trading in for the last month. If it can break above, I believe a quick rise to $6,750 is likely.
In today's video analysis, I discuss where price may go from here, traps to avoid, my elliot wave count and MUCH more. I hope you find it helpful.
Video Analysis:
If you’re viewing this on a site other than Steemit, and you don’t see the above video, navigate to Steemit or TIMM (https://mentormarket.io/profile/@workin2005?aff_id=Workin2005) in order to watch.
BIAS:
Short Term: Neutral
Longterm: Very Bullish
I hope this has been helpful. I’d be happy to answer any questions in the comment section below. Until next time, wishing you safe and profitable trading!
Workin
If you found this post informative, please:
Open an Account on Binance here:
https://www.binance.com/?ref=16878853
Support the Crypto Ecosystem with Brave Browser:
https://brave.com/wor485
Twitter handle is @Workin2005 and Facebook is https://www.facebook.com/Workin2005
Published on:
by Workin2005
Nice work Workin, it's going to take some nasty short squeeze/buying volume to break out as there is no auction north of $6500, there's a tiny balance at $6700 (red arrow) but it's likely the price would not stick there for long but would run straight for $6900.
I think the possibility of a large short squeeze is becoming increasingly probable.
Humm, I think the best case scenario at this point would be some consolidation throughout September but wouldn't mind shorts get destroyed to give the market some breathing room, this shorting Bitcoin trade is becoming a tad overcrowded.
I'd love to see it BB.
Thanks @tradealert. Always appreciate your views.
You're looking at a tether pairing and you're viewing it on a zoomed in 1 hour chart. Pull back a little, or view a 4 hour or daily, and you'll get a better idea. Remember, volume profile only shows you what you put on the screen.
Anyway...I wish it was like that across the board with other pairings like USD. If it was, there'd be nothing to stop it between $6,540 and $6,750. Even so..there's still not much. That's why price has recently moved so quickly past that $6,540-$6,750 zone..both up and down. As I said in the video, the problem is getting past that $6,500-$6,540 resistance.
Looking at volume profile on the USD pairing, there's much more buying/selling taking place between those 2 areas than your tether chart. Still, price has just zipped past that zone in the recent past...suggesting there's not much resistance or support at all between those 2 price points.
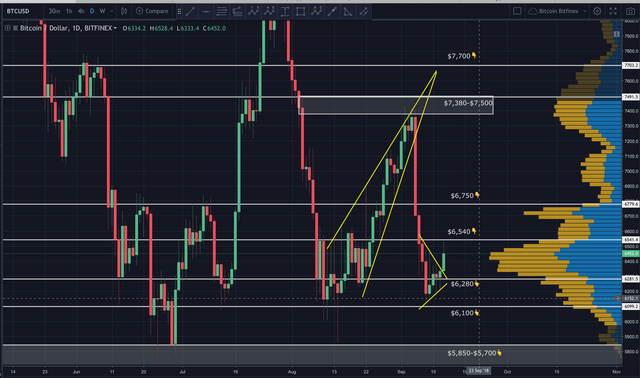
If price can rise above $6,540, the charts suggests a rather quick rise to at least $6,700. From there, it should find descent resistance. A break above $6,750 suggests price may retest the prior swing high.
I think we both agree here @workin2005, the volume well you see on the daily is the same I charted on the hourly (albeit the ellipsis I drew doesn't cover it entirely) and we were both correct to identify $6500 as a resistance zone.
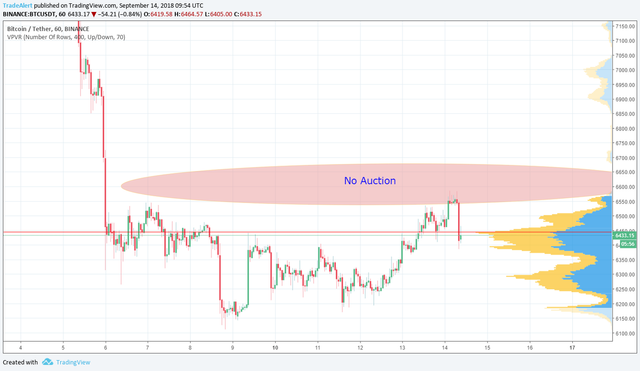
As for me charting on the Binance BTC/USDT chart, I chose it because it's the 3rd most traded Bitcoin market after Bitmex (derivatives) and BitForex (new market so not much price history) and I was always told to do TA on the most liquid market :)
Oh..maybe I misunderstood. Sorry if I did. I couldn't agree more on that $6,500-$6540 resistance. I thought you were calling resistance between $6,540-$6,750....the area price as zipped through both up and down. Again..my bad if I misunderstood.
As far as the volume profile, here's what I'm referring to...
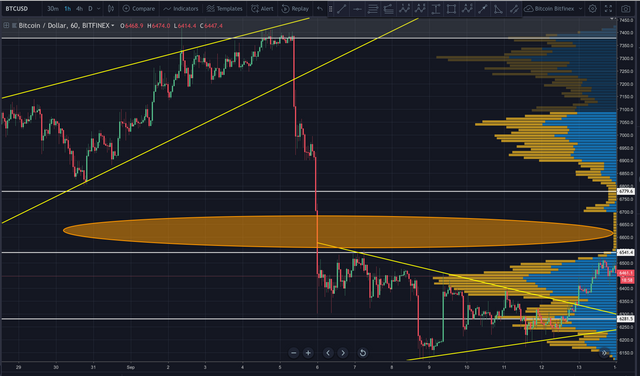
If I zoom in on the hourly, it looks like a ghost town between $6,500-$6,700.
Example:
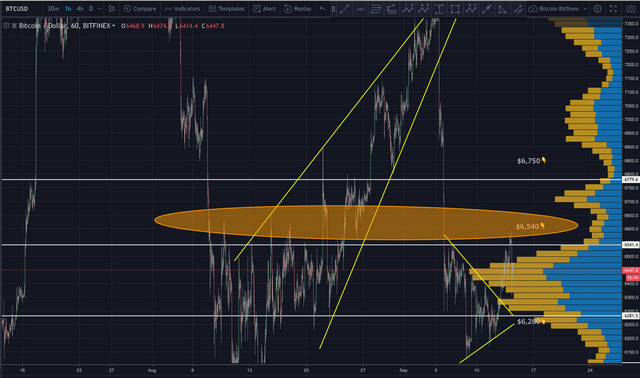
However, if I zoom out to cover more time (regardless of it's the hourly or daily chart), you'll get a little better idea of the action that's taken place in that zone over the past 6 weeks instead of just 2 weeks. That zone still looks weak, but it's not the ghost town it appears to be when zoomed in.
Example:
Of course you don't need volume profile to see it...the candles paint a pretty good picture. But it's certainly a nice feature to use. I've actually fallen in love with VP...even though it's making me lazy. lol
As far as using Binance BTC/USDT due to overall volume...yeah. That's not a bad call. I use Bitfinex as the volume is decent and it factors in shorts. (Notice that long wick on Sept 2nd that wasn't visible on Binance/Coinbase/etc).
Still, it doesn't really matter unless you're scalping on small timeframes...which is where I tend to make the most in this market.
Here's hoping we soon get an influx of new money. I'm waiting for a stable trend that isn't down. lol....I always feel like I'm cheating by shorting the market.
Anyway...hope I didn't come across as a condescending ass earlier. I was responding quickly to things on many different social sites and didn't put much thought into how it might have sounded. I'm not "that guy" who always has to correct everyone. I guess you caught me at a bad time. Sorry my friend.
Not at all dude, this is not Reddit and I have nothing but respect for your work :)
We have to see if this is not an A-B-C correction, being now B under construction... IMO, C is missing...
Yeah...I pointed that out in the video. I can carve out an ABC on lower timeframes, but it's messy. If this is a B, then presumedly the C would very likely drop below the start of wave 1...unless it's a VERY shortened C. If that happens, I'd invalidate the big picture count and things get interesting. Likely turns it into a WXYXZ...and likely sets new 2018 lows.
Until price breaks above $6,750, I remain very skeptical that we’ve seen bottom.
It seems that over the last 3 months, we have seen some signs of higher lows when these oullbacks have occurred. While I am concerned on the multiple tests of these supports, this could continue establishing a good support level to build upon.
Could be. If price can establish itself above $6,750...I'll be much more optimistic.
some see that wedge as an inverse H&S which would target around the $6750-6800 area (which is the reappearing resistance/support level), and also the .5 fib resistance pulling from 7400 to 6100 recent low.
Analysis just wow