Bitcoin...The Bulls Start to Fight Back

The bulls have been fighting back over the last 36 hours. As I've pointed out in my last few updates, Bitcoin is in 1 of 2 scenarios. Short term they look similar, but longterm they're very different.

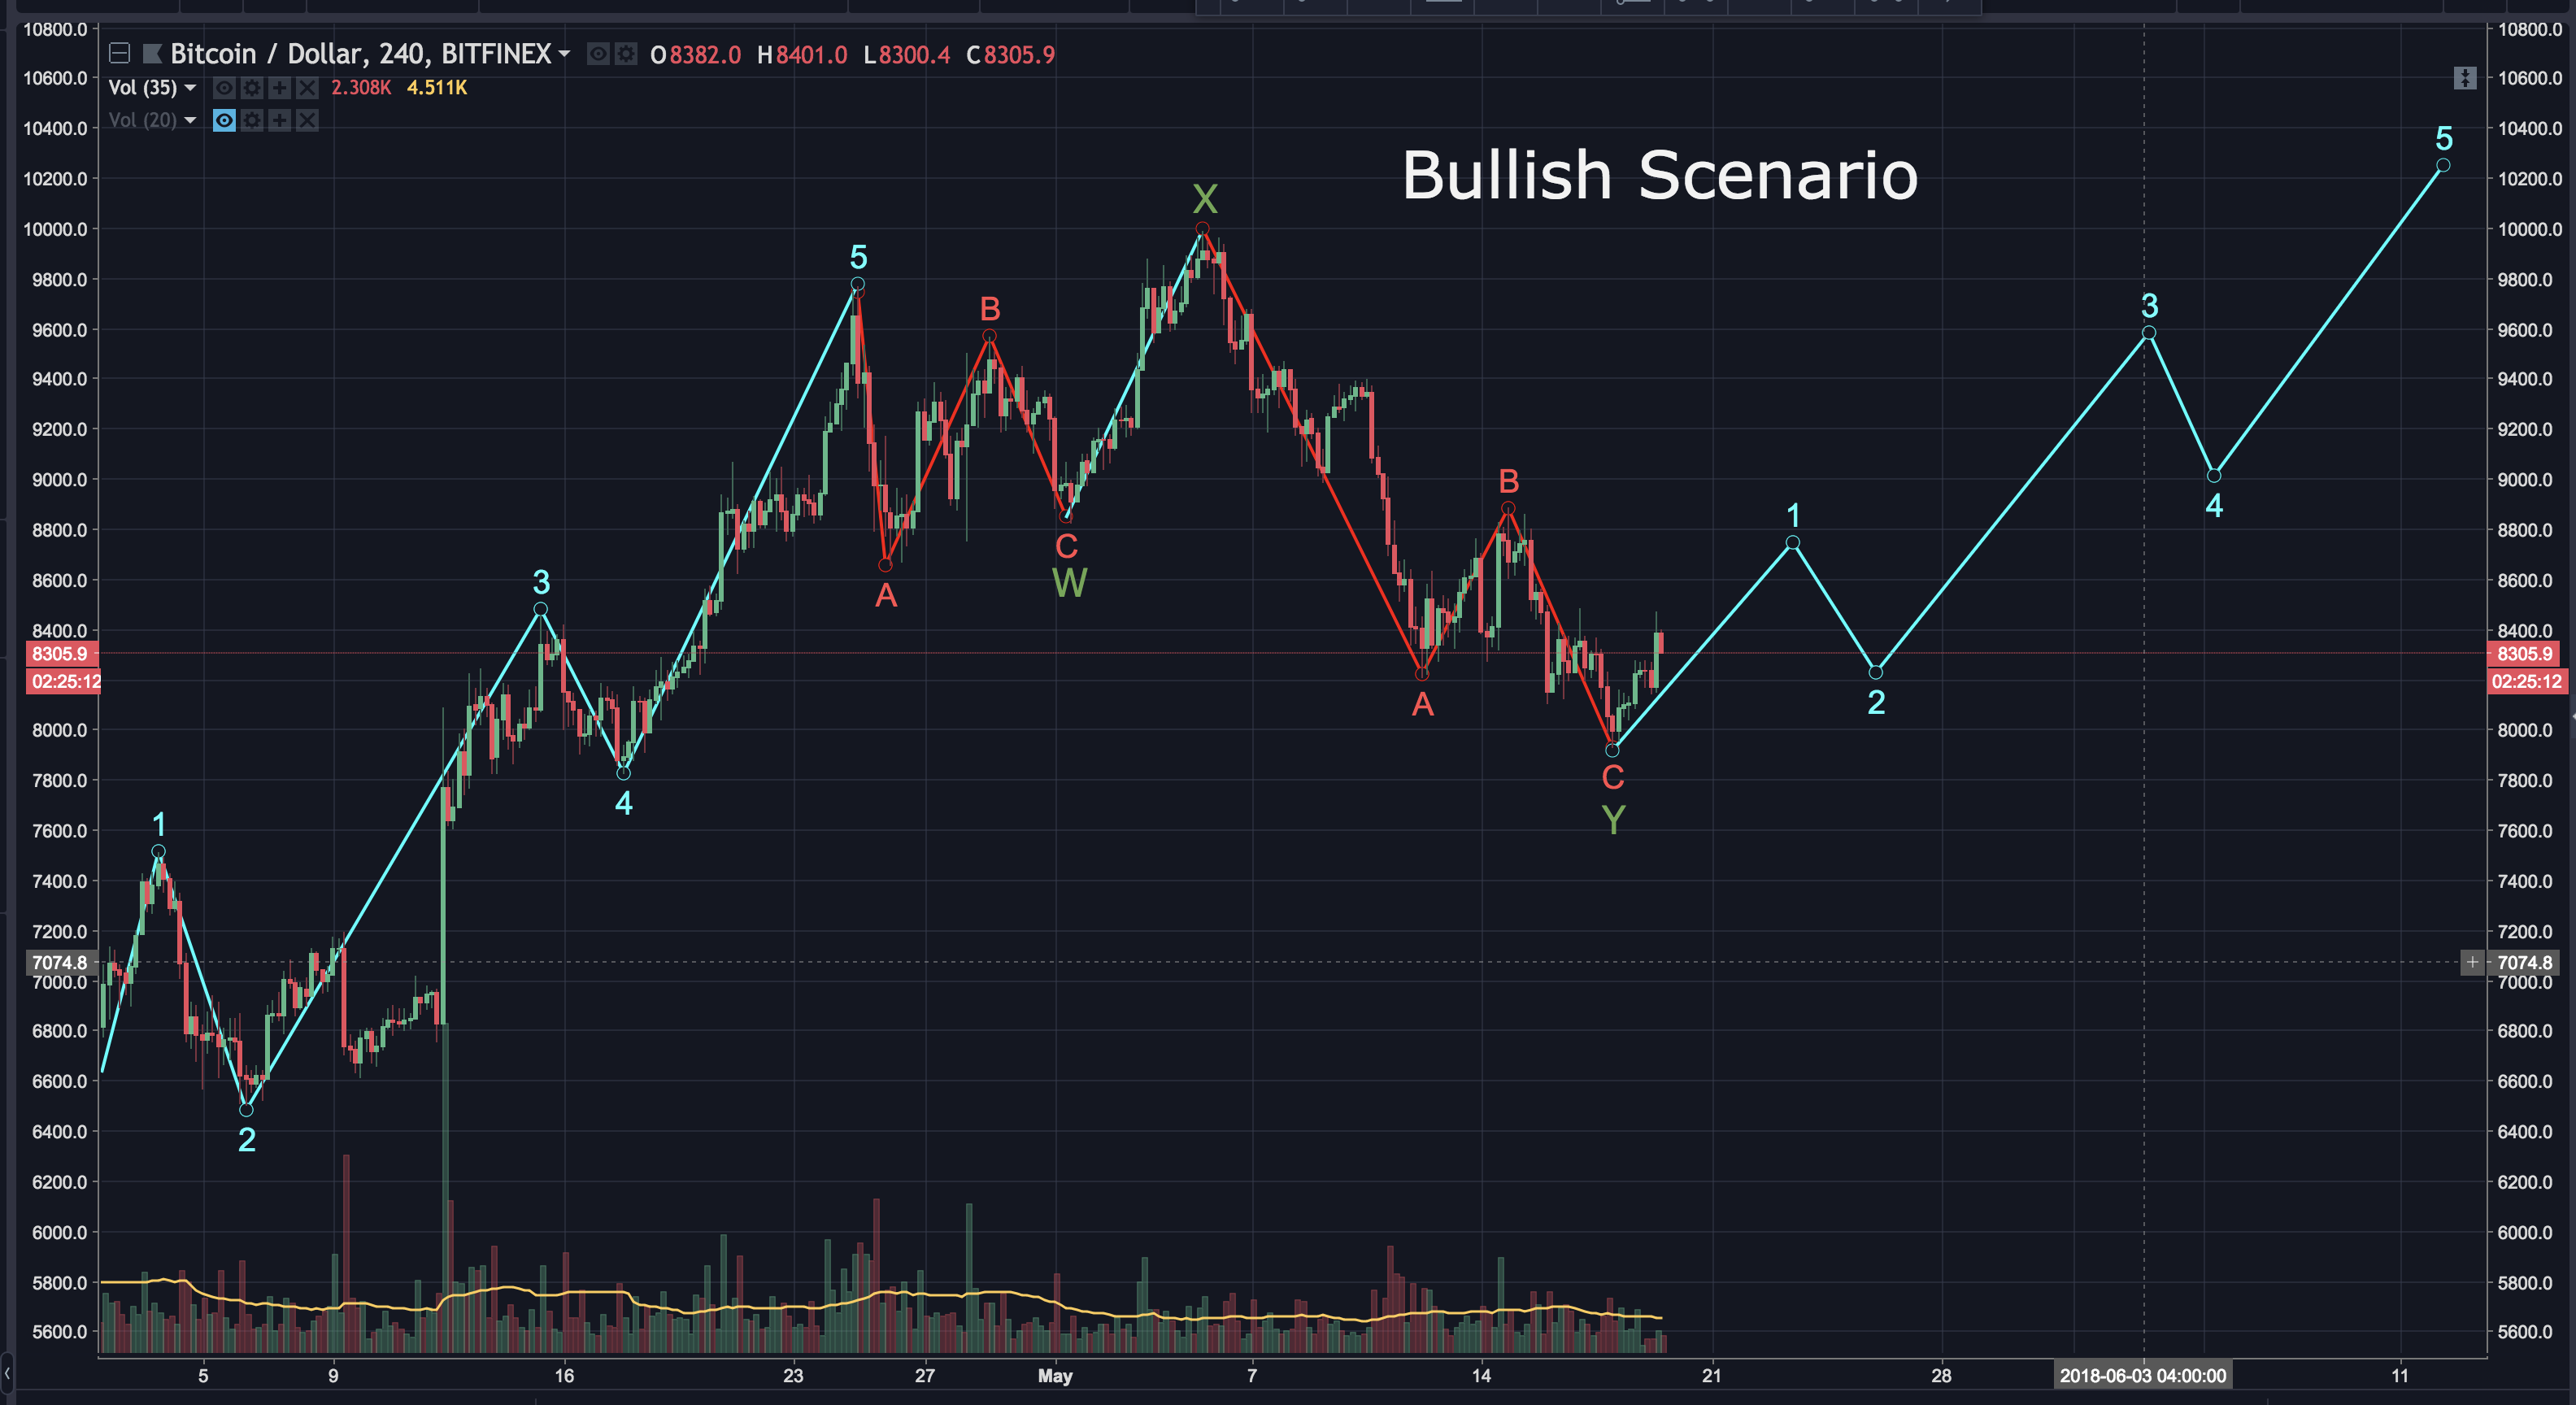
The first scenario is bullish. It's got bitcoin in an impulse wave up, having just completed a WXY pattern. If you're unfamiliar with a WXY pattern, please review my last few bitcoin updates. If this count is correct, it may play out like this:
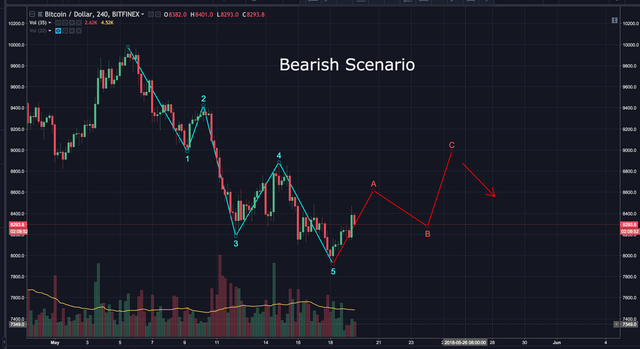
The bearish scenario has bitcoin having just completed 5 waves down. That would mean this current wave up is wave A of a possible ABC correction. If this is correct, here's how it may play out:
The market continues sending mixed signals. Volume remains fairly stable, but we need to see an increase for the bullish scenario to be validated. Looking the EMA's, we can see some positive developments. The 8 day EMA has been acting as resistance for the last 3-4 days. It just broke above, which is a bullish sign. It also looks like the 8 day EMA is about to cross above the 21 day EMA. If this happens, it would be another bullish indication of a strengthening market.
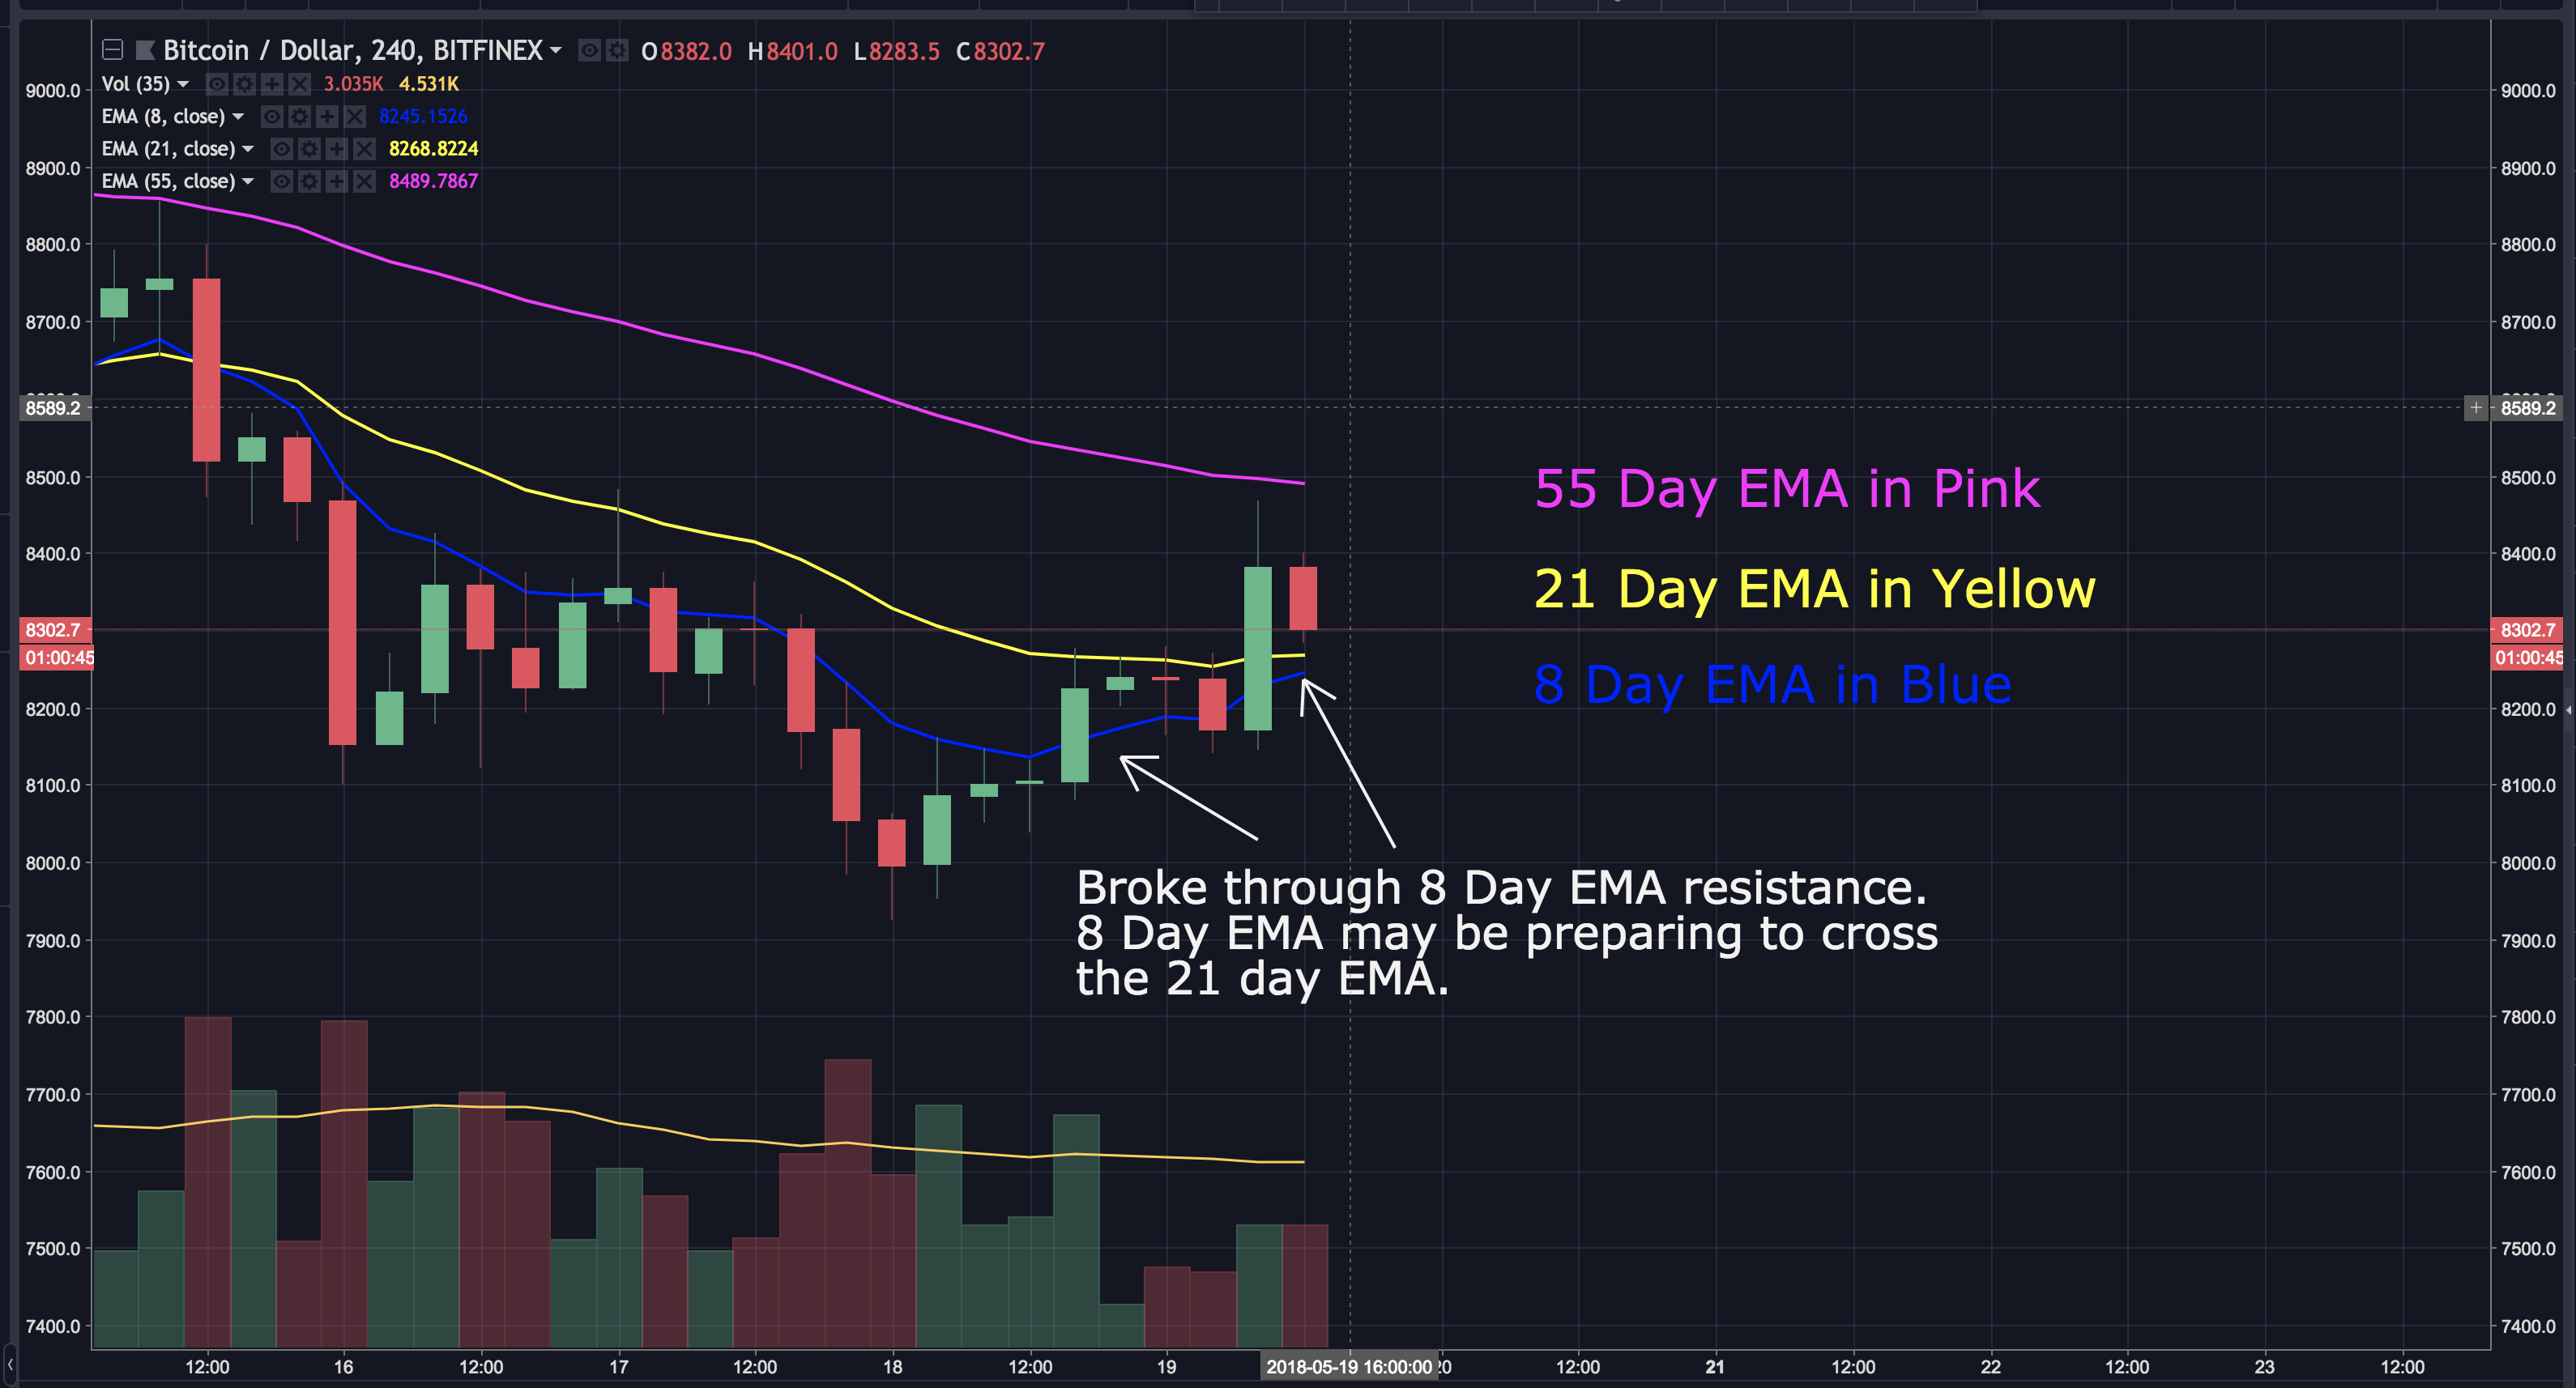
If you're unfamilar with how to use EMA's, refer to my post on the topic here: https://steemit.com/cryptocurrency/@workin2005/simple-effective-strategy-to-buying-and-selling-market-trends
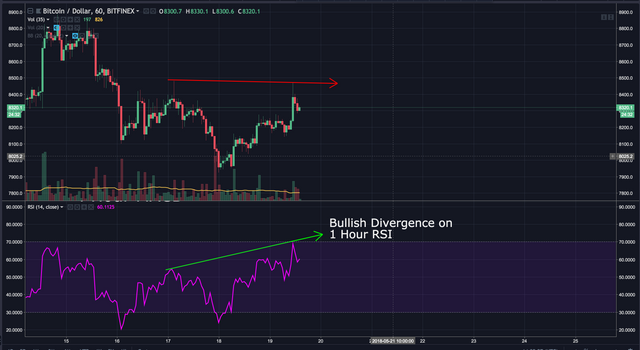
Looking at the 1 hour RSI, we can see clear bullish divergence...another sign the market may be strengthening.
Zooming out on the 1 hour chart, we can see a wedge has formed. To be clear, this is NOT a leading/ending diagonal. Some have labeled it this way. That's NOT correct. It's simply a wedge made of descending support and resistance lines that are converging. As the price gets closer to the apex, a breakout up or down becomes more likely. The price briefly broke out with just a wick, but was quickly rejected back within the wedge.
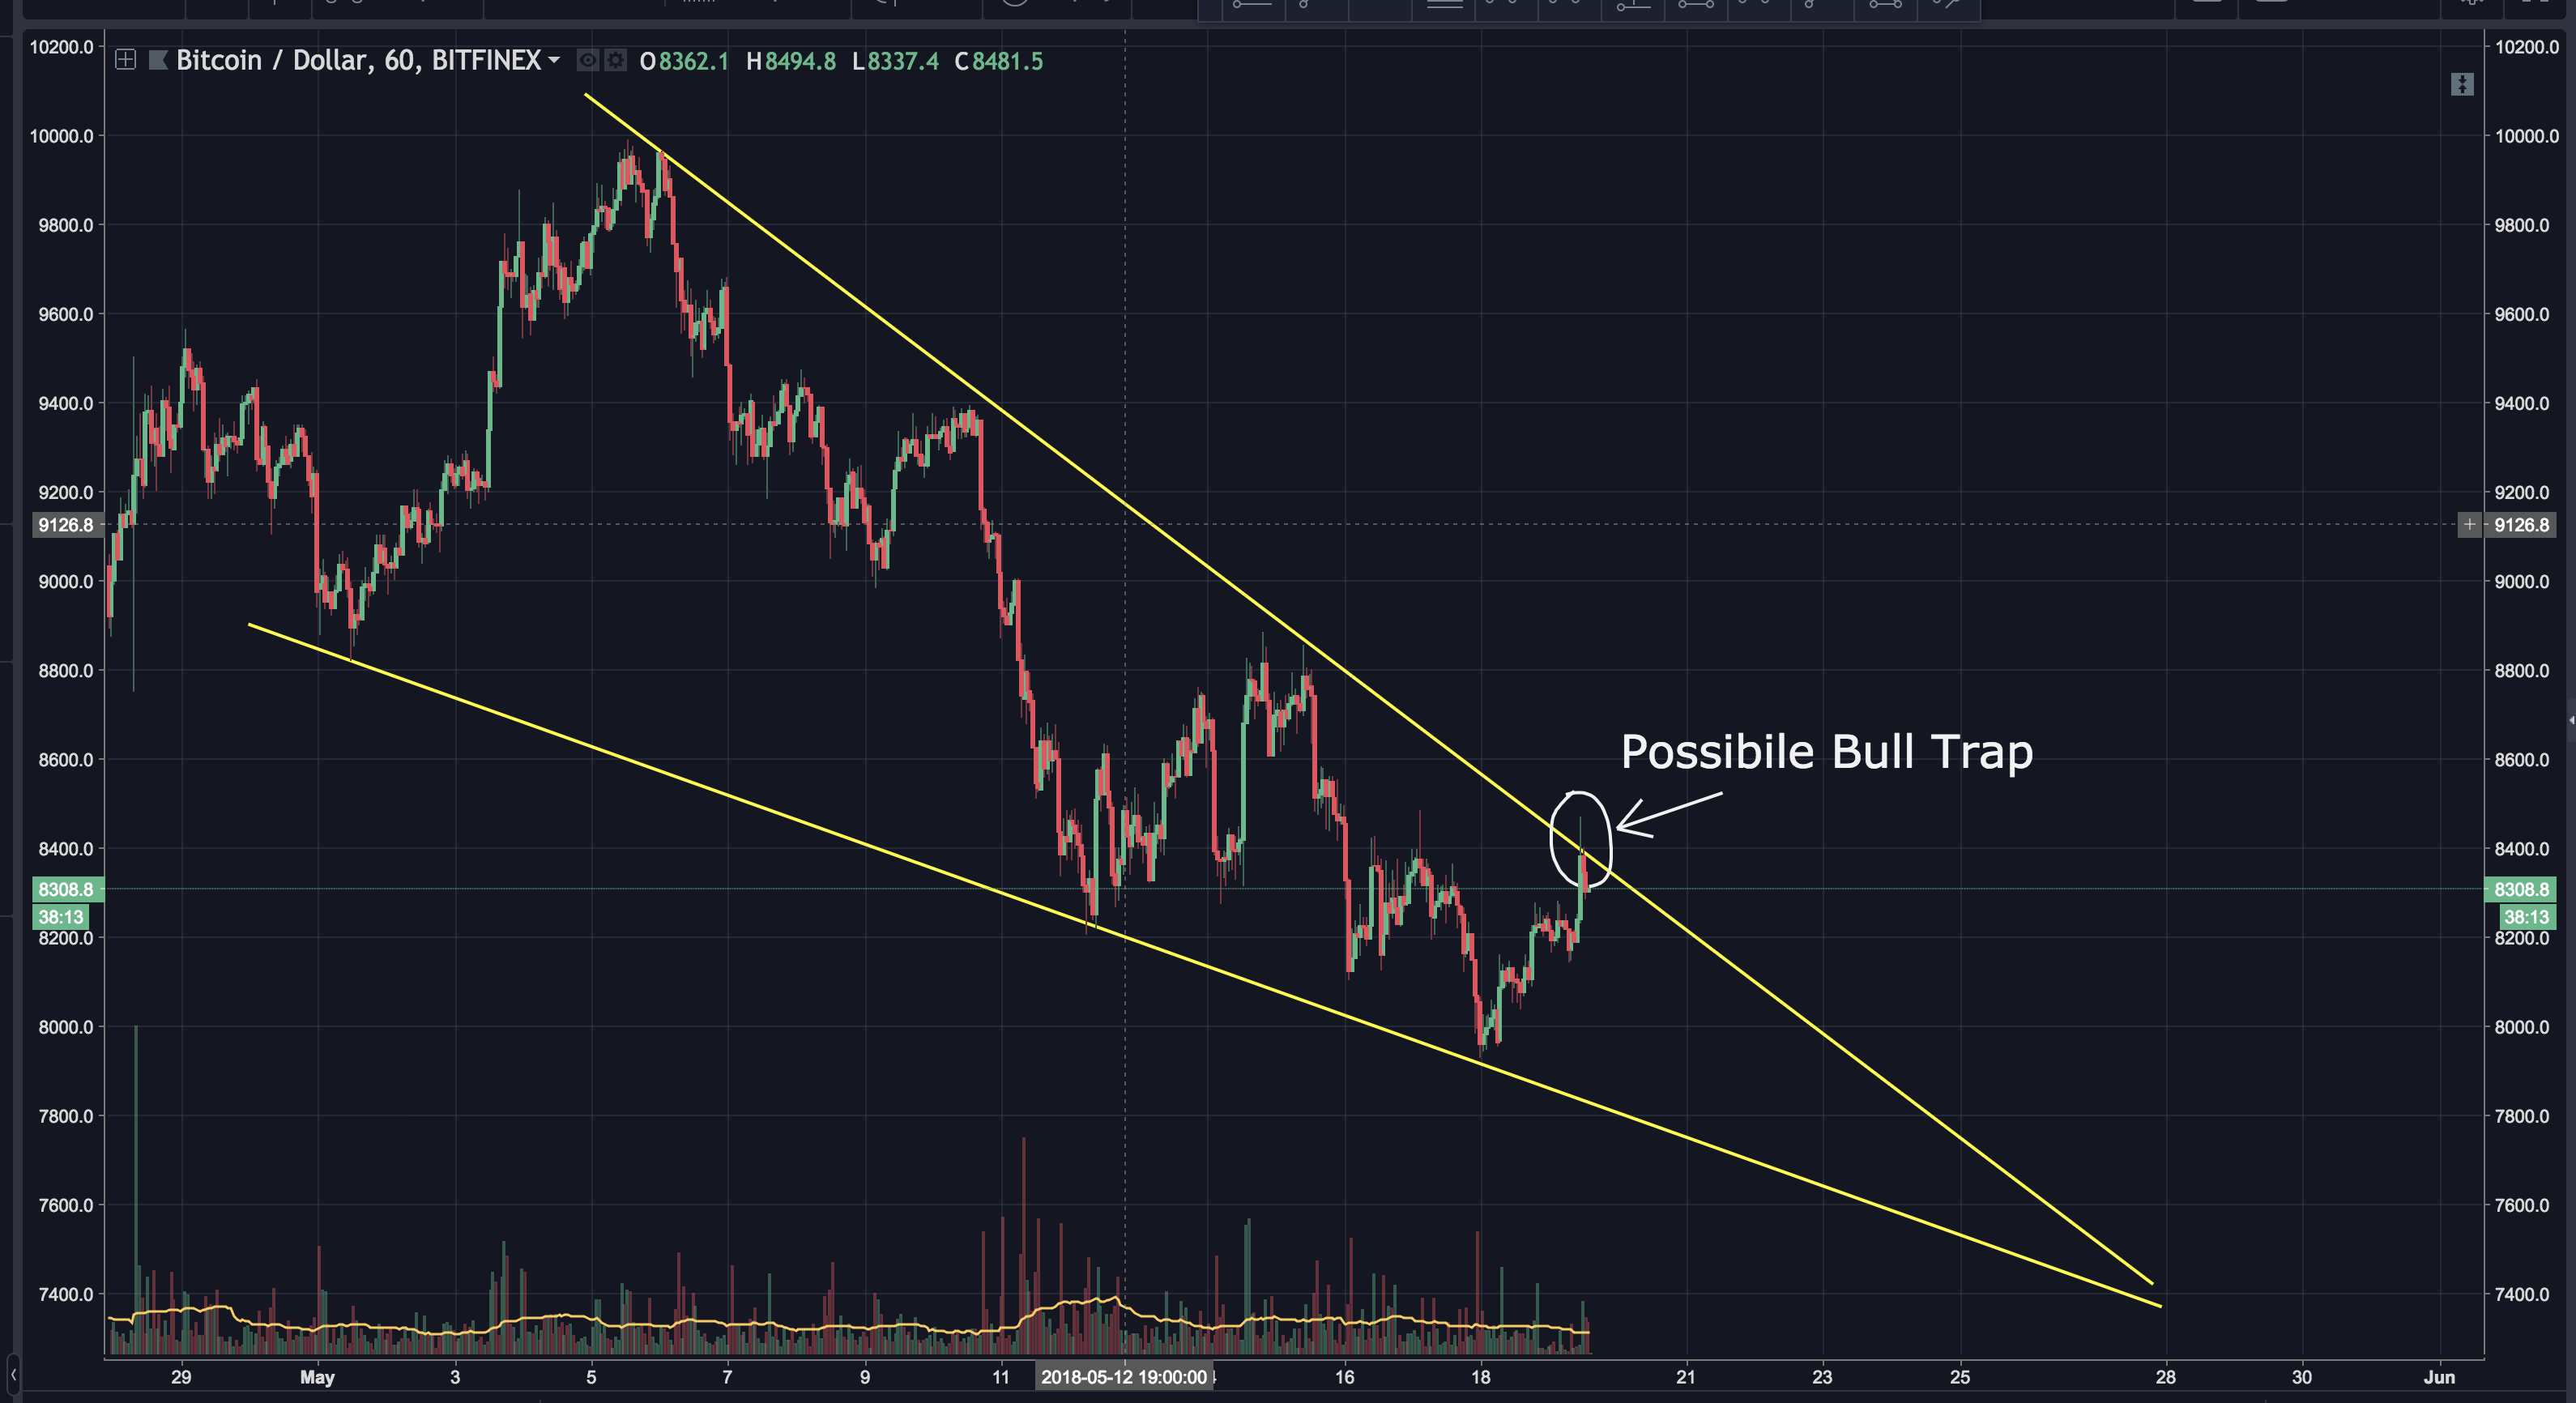
This could be labeled a "bull trap"...something that causes investors to buy in, only to quickly have the bears take their money. This is why it's important to always wait for confirmation. In this case, make sure the price remains above the wedge for at least 2 hours.
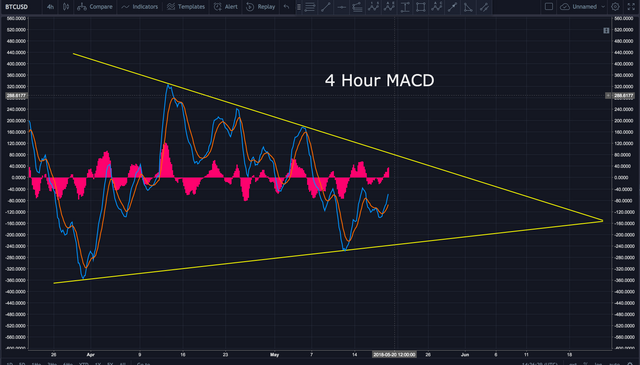
There's another wedge that's formed on the 4 hour MACD. Like above, the closer bitcoin gets to the apex, the more likely a breakout up OR down is to occur.
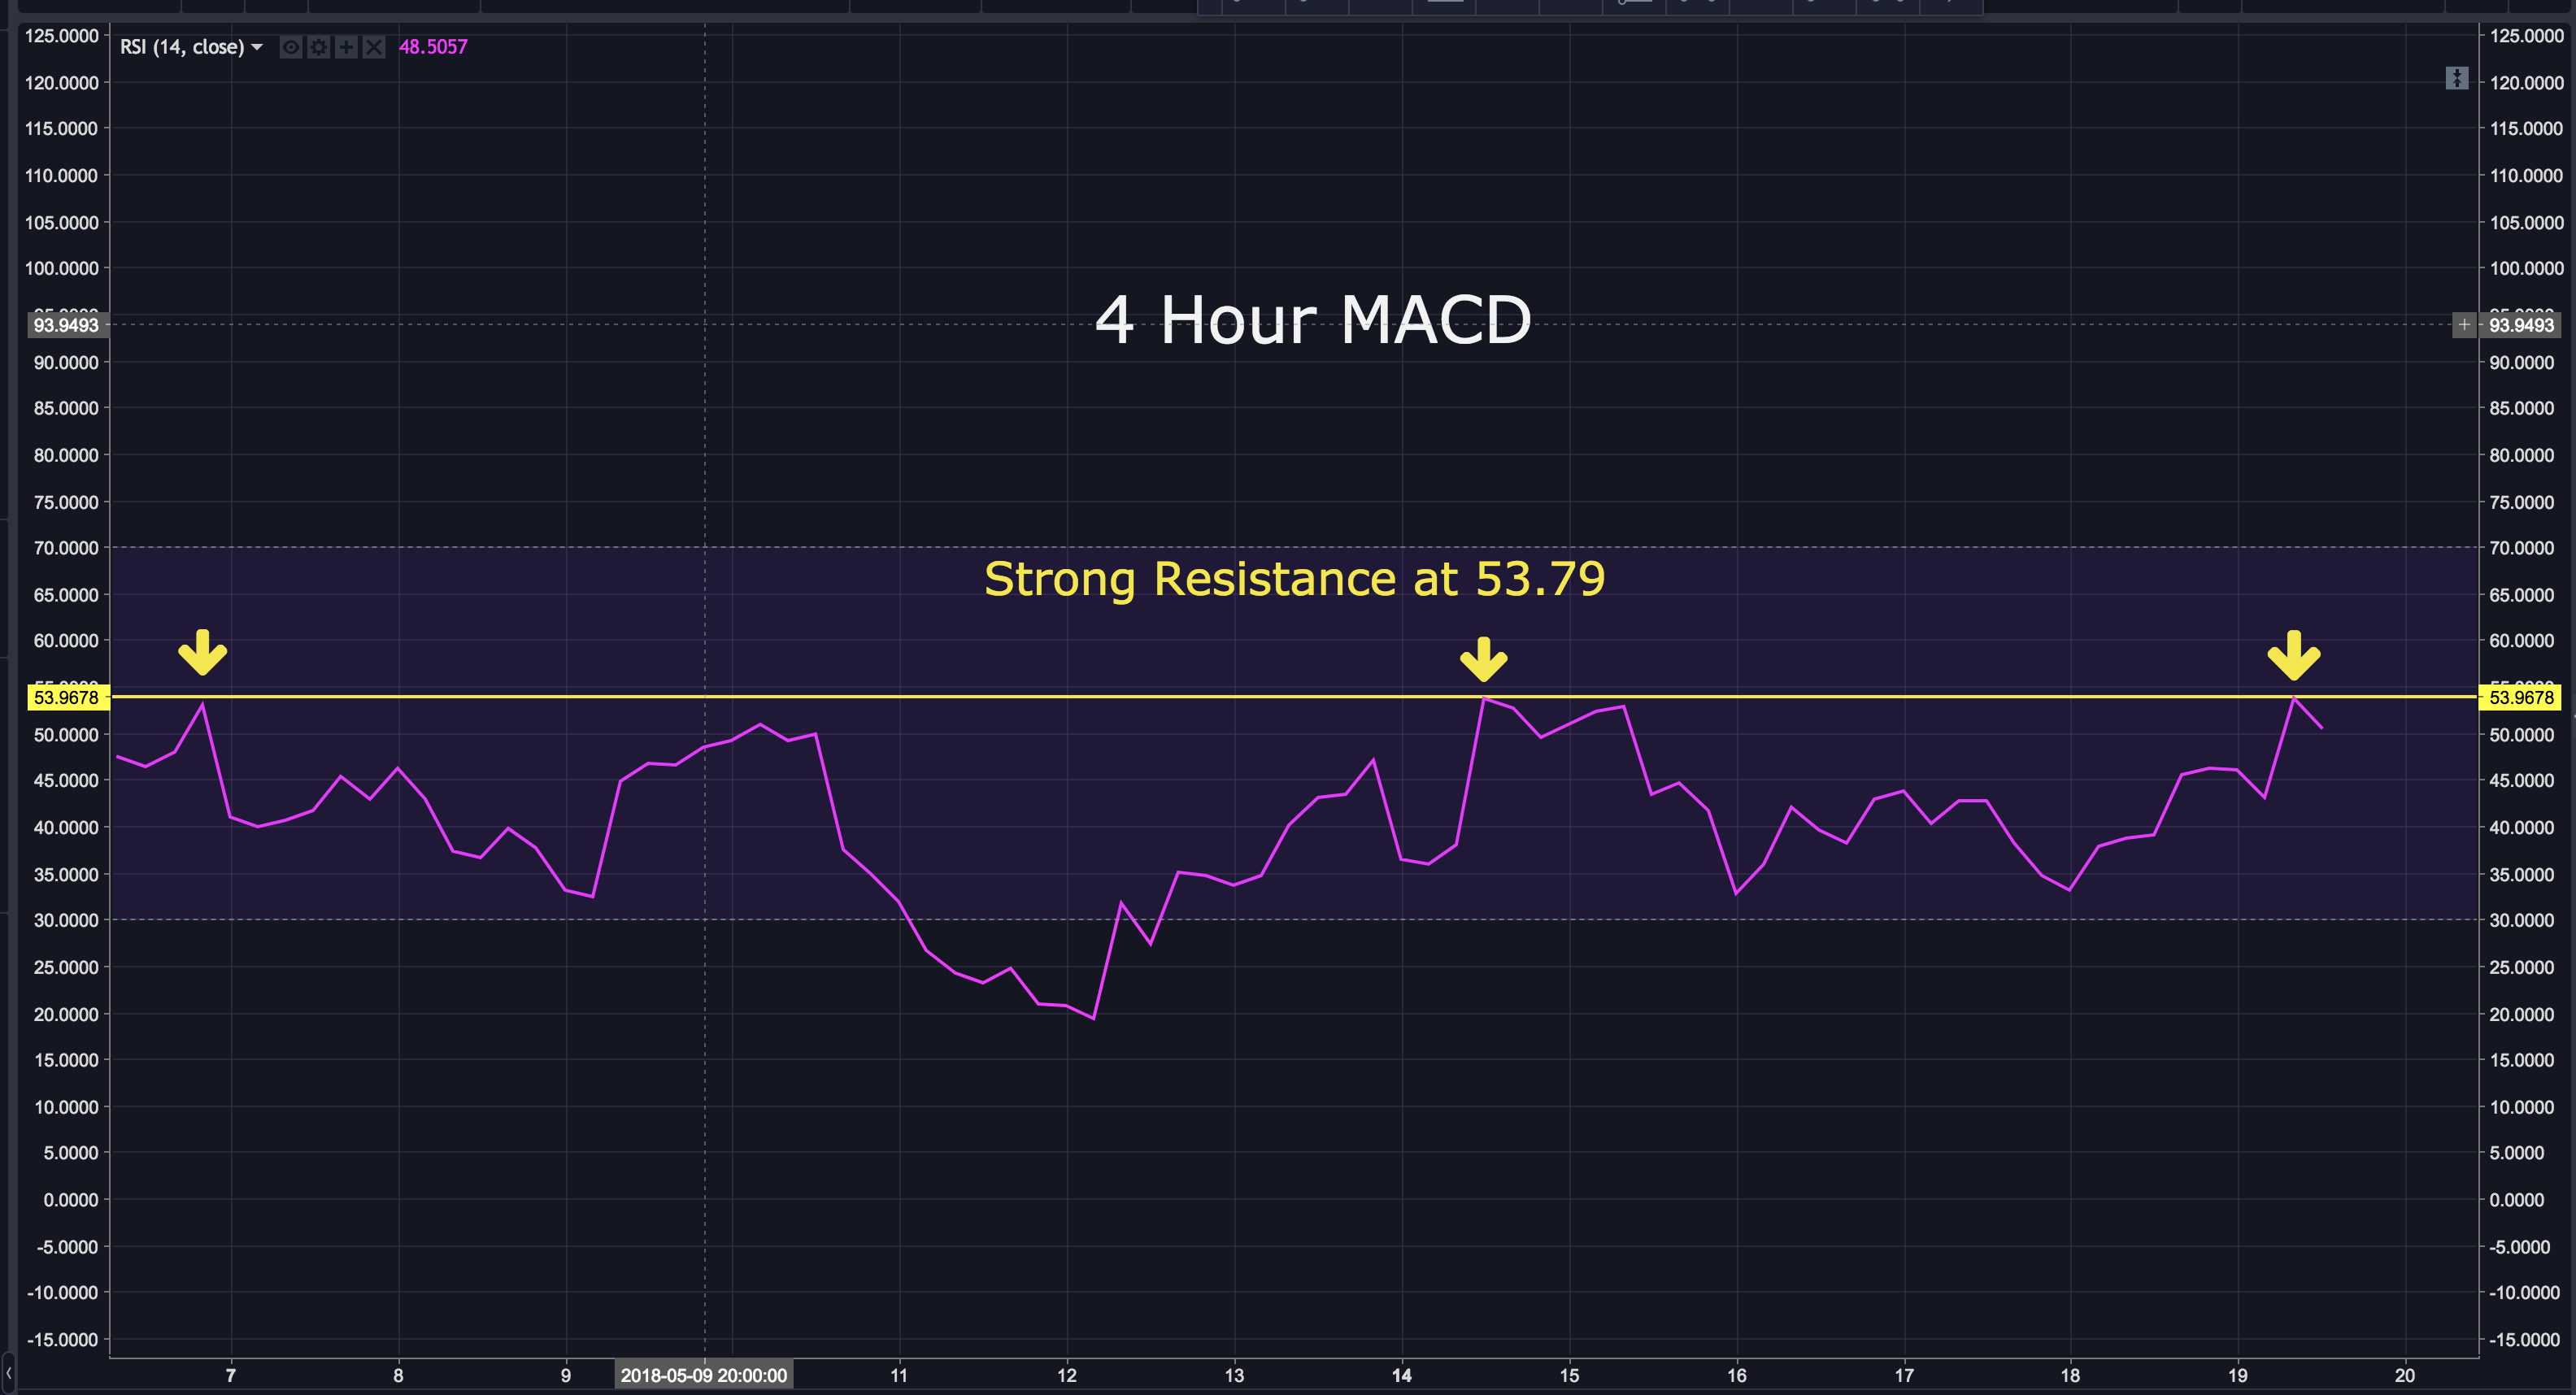
Looking at the 4 hour RSI, we can see strong resistance has formed at 53.79. We need bitcoin to break this resistance if the bullish scenario is to be validated.
Let's keep an eye on the indictors I've pointed out. The next week will be very telling.
BIAS:
Short Term: Neutral
Longterm: Very Bullish
I hope this has been helpful. I’d be happy to answer any questions in the comment section below. Thanks for stopping by.
If you found this post informative, please:

Disclaimer: I am NOT a financial advisor and this is NOT financial advice. Please always do your own research and invest responsibly. Technical analysis is simply a guide. It doesn’t predict the future. Anyone that claims they know exactly what’s going to happen is foolish, lying or both. Technical Analysis should only be used as a tool to help make better decisions. If you enter a trade, I recommend having a stop loss and sticking to it. You will loose at times. The key is to have more wins than losses. With that in mind, I wish you great success.
If you don’t have an account on Binance, I STRONGLY recommend getting one. They’re usually the first to get reputable coins, have excellent security and second to none customer service. You can sign up here free of charge: https://www.binance.com/?ref=16878853
![]()
I've read many other analysts, but you've been the most realistic and honest by far. Many just paint a bullish picture knowing that's what people want to hear. You actually lay out the facts as they are, with no bias. I really appriciate that.
Thanks my friend
The pace of the market has really slowed down since last year, look how long it's taking relatively speaking for this correction to play out. Last year before CBOE and CME added their options and futures, this kind of laborious and inconclusive evaluation didn't present itself, or am I wrong? I wasn't following technical blogs like yours last year, so please say if I am mistaken. We must exercise restraint and patience, always, even more important now that we are approaching an inflection point.
Last year was very different for the reasons you listed and more. We didn't have futures, but more important, we didn't have the threat of the SEC labeling certain crypto (like Ethereum) a security. We need new money in order to have another bull run. New money is waiting on regulatory clarity. Until we get that, the market will remain fairly difficult to predict in my opinion.
Thanx I see you also follow my blog. Good analysis keep up this good and realistic estimates. Indeed after May 21 we probably go up.
Thanks @goldmine2018
Hey @workin2005
So much great information. Thanks for posting.
Gaz
Thanks Gaz. Hope you're doing well my friend.
All good here. Even better with some green candles! 😁