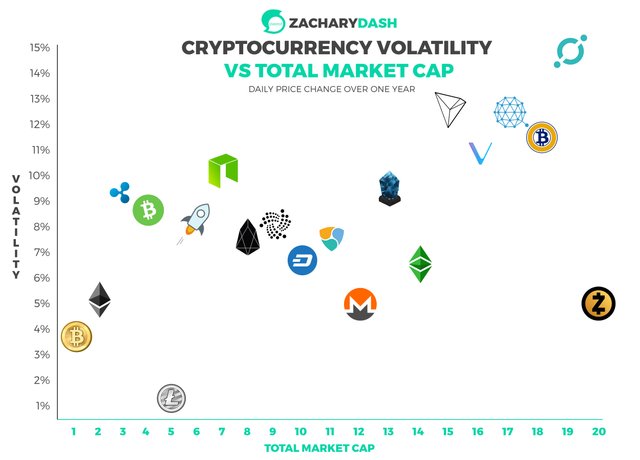
Cryptocurrency Volatility vs. Total Market Cap - Illustrated in One Picture
A lot of digging through data, but really happy with the outcome. Information was pulled directly from CryptoCompare on each coin in the past 365 days (starting February 15, 2017). Volatility was measured using Standard Deviation in relation to the daily change in OPEN price, relative to USD. If this gets enough feedback and support, I would also like to do more coins and focus on the prices relative to BTC.
Notes
Cardano is missing as there was incomplete data
NEO data starts after the re-brand on August 5, 2017
LSK data starts February 22nd, 2017
XEM data starts June 2nd, 2017
BTG data starts September 26th, 2017
TRX data starts October 10th, 2017
VEN data starts October 10th, 2017
QTUM data starts November 18th, 2017

More About Me
Very nice idea @zacharydash and very informative. Could you make it again for the time-periode from December 2017 till now? I think that would change the picture dramatically.
I just did some test for a 3 month span and it did change things up a lot. Will post soon. Thanks for the support.
Nice idea. Gives some new insights. You should also do a plot is CAGR against volatility. This will let us identify which coins are giving us consistent returns.