[D3.js] 실제 데이터로 로또볼 출력하기
[D3.js] 실제 데이터로 로또볼 출력하기
지난 시간에 이어 로또 사이트에서 제공되는 데이터를 다운받아서 로또볼로 출력해보는 실험을 간단히 해보겠습니다.
1. 각 회차 당첨번호 CSV 파일로 만들기
[1 단계]
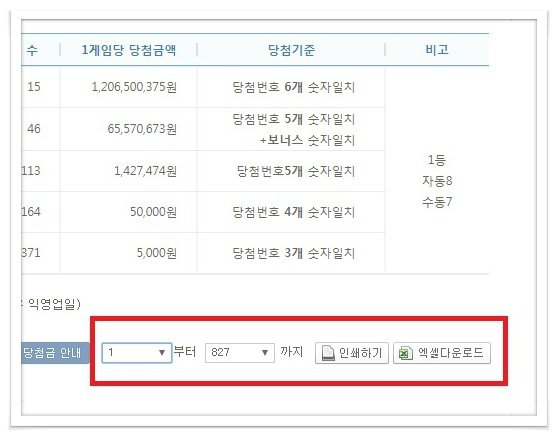
로또 사이트 가시면 아래 그림에서 보는 것처럼 원하는 회차 구간의 당첨번호를 엑셀다운로드 받을 수 있습니다.
[2 단계]
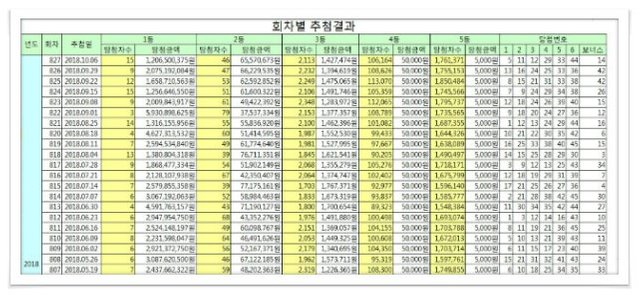
엑셀파일을 여시면 위 그림처럼 당첨 번호 데이터를 볼 수 있습니다. 여기서 필요한 정보는 회차, 당첨번호, 보너스번호만 있으면 됩니다. 그러면 나머지 데이터 정보는 필요 없기 때문에 삭제해야 합니다.
[3 단계]
행과 열의 셀을 통체로 삭제하면 됩니다. 위 그림에서 년도는 필요 없으니 A열을 클릭해서 A열을 통체로 날리면 년도을 지우게 됩니다. 나머지도 행과 열을 그런식으로 삭제하시면 됩니다.
[4 단계]
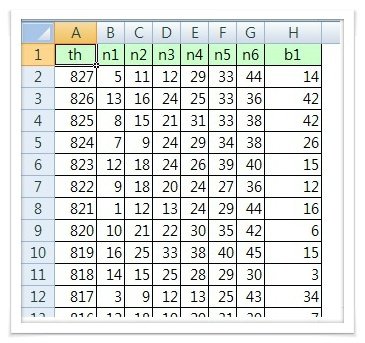
필요없는 행과 열들을 삭제하면 아래와 같이 정리가 됩니다. 그리고 위 이름만 수정해주시면 기본 data 틀이 완성이 됩니다.
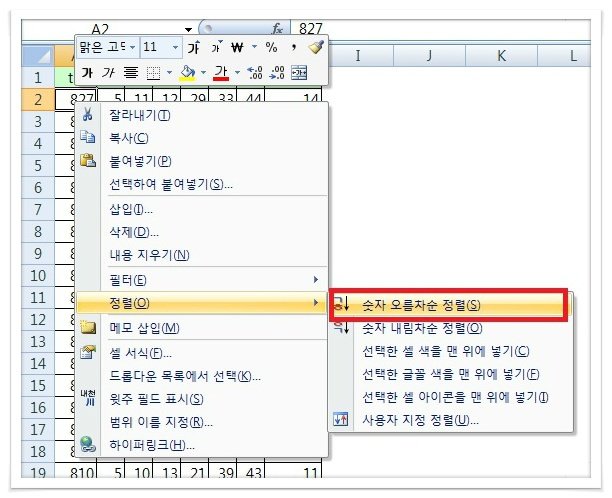
[5 단계]
오름차순으로 정렬을 합니다.
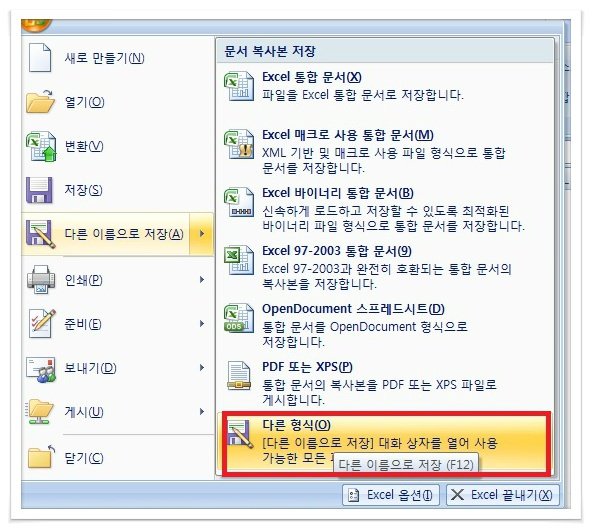
[6 단계] : CSV 파일로 변경
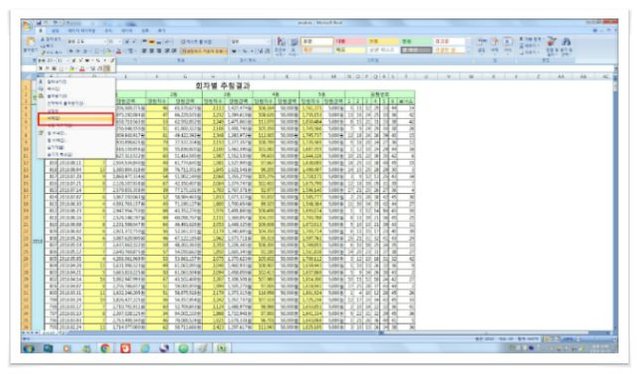
CSV 파일로 변경하기 위해서는 아래 그림처럼 다른 이름으로 저장하기를 누른 다음 다른 형식을 먼저 누릅니다.
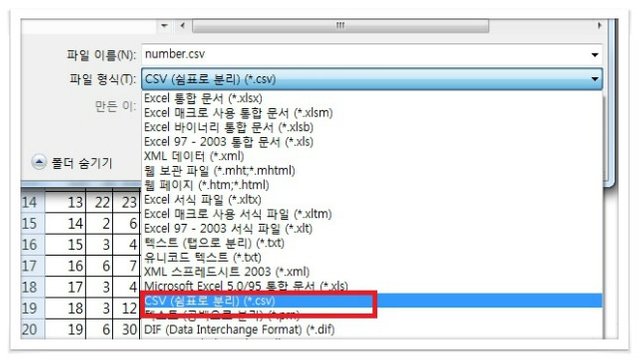
그 다음으로, 파일 형식을 아래 그림처럼 CSV로 하고 저장 파일 확장자를 CSV로 해서 저장하면 됩니다.
그리고 나서 메모장으로 열면 다음 그림처럼 보여집니다.
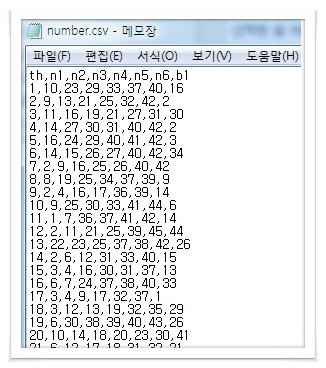
이렇게 해서 number.csv 파일을 만들었습니다. 이 로또 당첨번호 데이터 파일을 이용하여 D3.js 함수를 이용하여 로또볼 시각화를 해보겠습니다.
2. 로또 당첨 데이터를 로또볼로 시각화
(1) CSV 데이터파일 읽기
- 사전학습 : [D3.js] CSV 파일 읽는법
우선, CSV 파일을 읽어와야 겠죠. 읽어온 로또 데이터는 dataset에 저장되어 있고 로또볼 시각화는 reder(dataset)으로 시각화를 수행합니다.
 d3.csv("number.csv",type).then(function(dataset) {
    render(dataset);

  });

  function type(d){
    d.n1=+d.n1;
    d.n2=+d.n2;
    d.n3=+d.n3;
    d.n4=+d.n4;
    d.n5=+d.n5;
    d.n6=+d.n6;
    return d;
  }
(2) 로또볼 시각화
- 사전학습 : [D3.js] 로또볼 만들기
사전학습에 사용한 코딩을 그대로 적용합니다. 이부분을 사용자 정의 함수로 render()함수를 만들어 로또볼 코딩을 다 집어 넣습니다.
 var ColorScale =  d3.scaleQuantize().domain([1,50]) //color 범위 지정함
      .range(["orange","blue","red","black","green"]);
function render(dataset){
 dataset.forEach(function(d){  //전체 객체배열에서 한객체씩 읽어옴
      var th = d.th;  //회차를 나타냄
      var ch;
      var data=new Array();

      for(var i=0;i<6;i++){  //로또 당첨번호 data[]저장
        ch="n"+(i+1);
        data[i]=d[ch];
      }
      data[6]=d.b1; //로또 보너스번호 data[6]에 저장

      var svg = d3.select("body").append("svg") //캔버스 영역 지정
        .attr("width",1000)
        .attr("height",50)
        //.style("background-color","yellow")
        .append("g")
        .attr("transform", "translate(" + 20 + "," + 20 + ")");

      var circle = svg.selectAll("circle").data(data) //볼 circle
          circle.enter().append("circle")
            .attr("cx",function(d,i){ return i*50+100;})
            .attr("cy",5)
            .attr("r",20)
            .attr("fill",function(d){return ColorScale(d); })
          circle.exit().remove();

      var text = svg.selectAll("text").data(data) //번호 text
          text.enter().append("text")
          .attr("x",function(d,i){ return i*50+90;})
          .attr("y",15)
          .attr("fill","white")
          .attr("font-size","25px")
          .text(function(d){return d;})
          text.exit().remove();

      var chtext = svg.append("text")  //회차 text
          .attr("x",0)
          .attr("y",15)
          .attr("fill","blue")
          .attr("font-size","25px")
          .text(th+"회"); //회차 번호를 출력
    });
  }
(3) 종합 소스
<!DOCTYPE html>
<html>
<head>
   <meta charset="utf-8">
  <script src="https://d3js.org/d3.v5.min.js"></script>
  <title>JS Bin</title>
</head>
<body>

  <script>

    var ColorScale =  d3.scaleQuantize().domain([1,50]) //color 범위 지정함
      .range(["orange","blue","red","black","green"]);
function render(dataset){
  dataset.forEach(function(d){  //전체 객체배열에서 한객체씩 읽어옴
      var th = d.th;  //회차를 나타냄
      var ch;
      var data=new Array();

      for(var i=0;i<6;i++){  //로또 당첨번호 data[]저장
        ch="n"+(i+1);
        data[i]=d[ch];
      }
      data[6]=d.b1; //로또 보너스번호 data[6]에 저장

      var svg = d3.select("body").append("svg") //캔버스 영역 지정
        .attr("width",1000)
        .attr("height",50)
        //.style("background-color","yellow")
        .append("g")
        .attr("transform", "translate(" + 20 + "," + 20 + ")");

      var circle = svg.selectAll("circle").data(data) //볼 circle
          circle.enter().append("circle")
            .attr("cx",function(d,i){ return i*50+100;})
            .attr("cy",5)
            .attr("r",20)
            .attr("fill",function(d){return ColorScale(d); })
          circle.exit().remove();

      var text = svg.selectAll("text").data(data) //번호 text
          text.enter().append("text")
          .attr("x",function(d,i){ return i*50+90;})
          .attr("y",15)
          .attr("fill","white")
          .attr("font-size","25px")
          .text(function(d){return d;})
          text.exit().remove();

      var chtext = svg.append("text")  //회차 text
          .attr("x",0)
          .attr("y",15)
          .attr("fill","blue")
          .attr("font-size","25px")
          .text(th+"회"); //회차 번호를 출력
    });
  }

  d3.csv("number.csv",type).then(function(dataset) { //CSV 데이터 읽기
    render(dataset);
  });

  function type(d){
    d.n1=+d.n1;
    d.n2=+d.n2;
    d.n3=+d.n3;
    d.n4=+d.n4;
    d.n5=+d.n5;
    d.n6=+d.n6;
    return d;
  }
  </script>
</body>
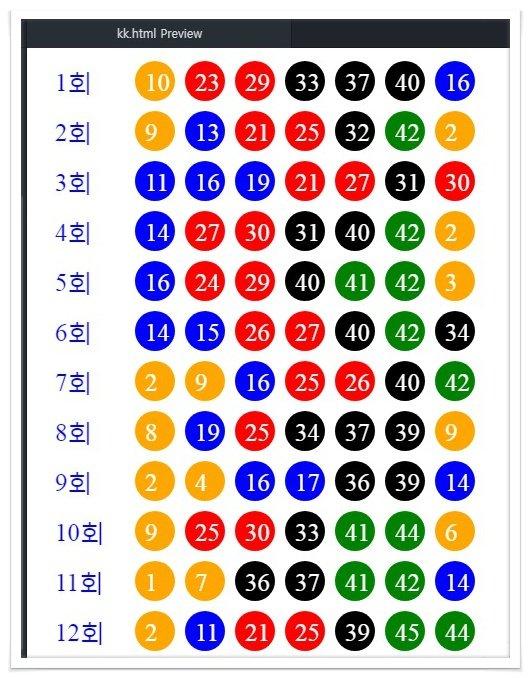
[결과]
로또 사이트 처럼 일정 갯수 만큼만 보이게 게시판 형식으로 만들면 좋은데 그냥 일괄적으로 쫙 한번에 보이게 출력 했네요.
마무리
여기까지가 기본 로또볼 시각화 입니다. 이 기반으로 데이터를 읽어 올수 있고 데이터를 시각화까지 되었다면 읽어오 데이터를 가공하면 새로운 응용 시각화를 만들어 낼 수 있습니다. 차트로도 만들 수 있고 또는 구간별 번호 출현 횟수를 계산해 낼 수도 있고 자신이 직접 랜덤으로 만든 번호가 지금깢의 횟차와 비교해서 어느정도 일치하는지 출현 횟수를 분석해 내어 시각화를 할 수도 있습니다.
상상력을 어떻게 동원하느냐에 따라서 다양한 시각화를 할 수 있기 때문에 한번 여러분들도 시각화를 도전 해보세요. 실전으로 재밌는 것을 만들 수 있을 거에요.
Sponsored ( Powered by dclick )
EOSDAQ 이벤트 에어드랍 받는법
10월 15일 이오스닥거래소가 이벤트를 합니다 탈중앙화 거래소를 하반기 오픈하기전 사전가입자 ...

이 글은 스팀 기반 광고 플랫폼
dclick 에 의해 작성 되었습니다.
대단합니다... .
챙피함!
기초적인 거라서요.
보기에 상당히 예쁩니다.
827회까지 당첨번호가 한페이지 나와 있어서 보기에는 좀 마음에 안드네요.
10개씩 페이지로 나누기해야하는데 그게 아쉬운 부분이네요. 그리고 숫자도 정확히 구슬 가운데에 나타나지 않아서 좀 아쉬움! ^^
Congratulations @codingman! You have completed the following achievement on the Steem blockchain and have been rewarded with new badge(s) :
Click on the badge to view your Board of Honor.
If you no longer want to receive notifications, reply to this comment with the word
STOPDo not miss the last post from @steemitboard:
Thank you.