You are viewing a single comment's thread from:
RE: If the liberals are right, and everything is getting WORSE
who ever made this chart is full of it . extreme poverty is below $1.9/day ? I can make you chart with extreme poverty below $0.01/day and there will be no poverty at all on this planet .
you misunderstand.
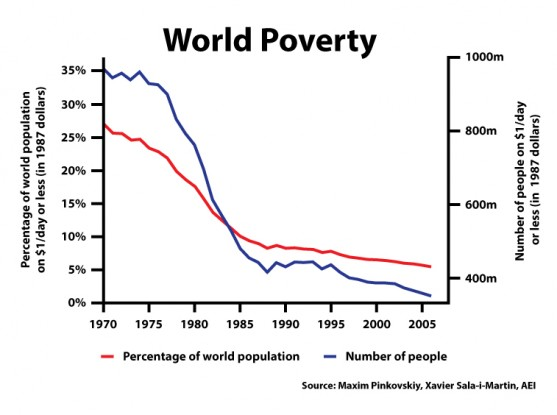
the chart merely depicts what it WAS
and what it IS.
but if using the dollar - as in this chart - from 1970 until today.....
and the dollar has devalued massively since 1970 - then on that standard - there is no other way for the graph to go.......as it devalues, the 'poverty level' will decrease.
living on a dollar a day in 1970 is not the same as livin' on a dollar a day now..
Just sayin'...
hmmm.
math hard.
but I think you have it backwards.
math hard . i think you are correct. - in how I described it ... lmao
my logic Is correct, honest...
ok lets say (for sake of argument, and prob close to accurate), $1 in 1970 is now the same as $15 dollars today....
We need to see how many people live on $15 a day or less
That will change the numbers now in 'poverty greatly - and is far more accurate.
My logic was correct - but my initial description was woefull ! lol
I knew there was sense in there... somewhere...
my head hurts.
IT's YOUR FAULT.
I'm gonna go pout.
😂😂😂
Pretty sure those charts are adjusted for inflation.
that blows my theory out of the water then, doesn't it?
lol
have you checked...? I haven't.