This Indicator has Predicted the last 7 U.S. Recessions. What's it saying now?
You may have heard the term 'Yield Curve' thrown around and thought:
"What does that even mean??"
Exciting stuff, I know.
Now before you go back to re-watching the Avengers Infinity War Trailer and fantasizing about $100 STEEM.

It's important, let me explain.
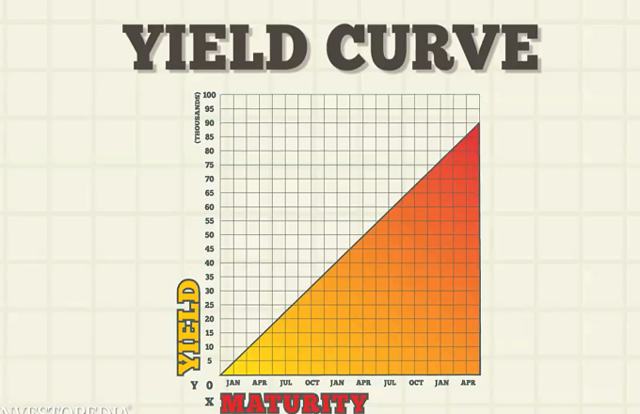
So Investopedia defines the Yield Curve thus:
"A yield curve is a line that plots the interest rates, at a set point in time, of bonds having equal credit quality but differing maturity dates. The most frequently reported yield curve compares the three-month, two-year, five-year and 30-year U.S. Treasury debt. This yield curve is used as a benchmark for other debt in the market, such as mortgage rates or bank lending rates, and it is also used to predict changes in economic output and growth."
Okay that was a lot to unpack, let's look at a quick example:
Steve: "Hey Bob can I borrow $20 bucks 'til next week?
Bob: "Get lost Steve".
Steve: "C'mon I'll give you $25 back to sweeten the deal, I'm trying to get sh*t canned tonight"
Bob: "Deal!"
Recap
- Steve is the borrower
- The bond is the $20 bucks Steve is borrowing
- The $5 bucks is the yield Bob's getting for lending his money to Steve.
- The maturity is next week. That's when Bob gets his money back.
Why does the Yield Curve matter?
The yield curve gives you an idea about the economic environment.
Bond traders are generally considered the risk averse "smart money".
So if all is not well in Oz, you can bet that the Bond market will be the first to figure it out.
Let's cover how to read the tea leaves:
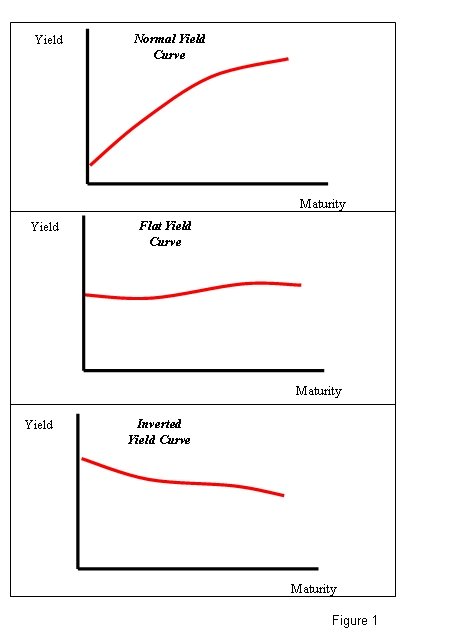
- Normal Yield Curve
A normal yield curve is the classic up slopping shape. Investors naturally expect more money (yield) in return for lending over longer time frames (10 yrs or more) than they would if only lending for 1-2 years.
Flat Yield Curve
A Flat yield curve occurs when there is little difference between the yield on longer dated debt relative to debt of shorter duration. It's generally happens when there's a transition to an inverted yield curve.Inverted Yield Curve
This occurs when long-term yields fall below short-term yields.
Why would anyone do this??
Historically this typically happens during times of economic instability and is a leading indicator of ECONOMIC RECESSIONS.
When short-term interest rates exceed long-term rates, market sentiment suggests that the long-term outlook is POOR and that the yields offered by long-term fixed income will continue to fall.
An Inverted Yield Curve has correctly predicted the last 7 Recessions going back to 1960!
To Quote Michael Pento:
"The last two times the yield curve inverted was in the years 2000 and 2006. The inversion and subsequent recession that began in the year 2000 caused NASDAQ stocks to plummet 80 percent. The following inversion caused the Great Recession in which the S&P 500 dropped 50 percent and, according to the Case/Shiller 20-City Composite Index, home prices fell over 30 percent."
In the current environment of a blazing housing market and record high stock prices, this is an indicator EVERYONE should be paying attention to.
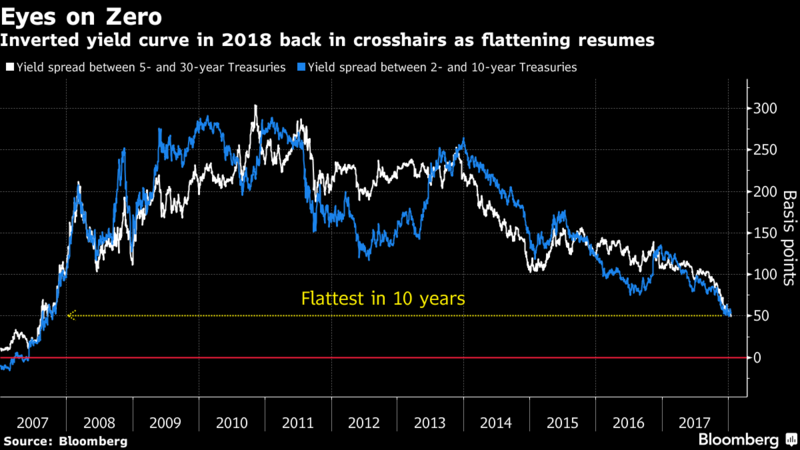
Currently the Fed has been steadily raising interest rates, while the 10 year has been trending downwards. If those trends continue, the yield curve will invert some time in 2018.
What do you think the chances are of an imminent recession?
Or is everything all good?
Until Next time.

It's your move.
JESS