Biomechatronics III: Visualizing Audio
Imagine you are about to have a child.
You go to the doctor to get an ultrasound, and you get to hear the baby's heartbeat for the first time! What a beautiful connection between parent and child — but what if you can't hear it?
For this project, I turned an ultrasound recording of a fetal heartbeat into an LED blinking to the pace of the heart.
The steps for how I did it:
- Convert audio signal into a plot of voltage over time
- Process the voltage data so it is perfectly clear when the heart is beating
- Quickly blink an LED when that data says the heart is beating
1. Convert audio signal into a plot of voltage over time
I was given the following recording:
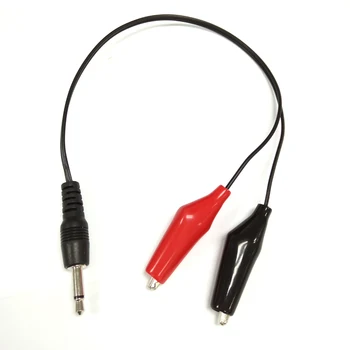
Using a cable, I converted what was coming out of the computer's audio jack from the recording into a basic plot of voltage changing over time.
I plugged the left end into the computer's audio jack. This cable split the information from the audio jack between the clips on the right end. I read the voltage difference across the clips (with black as ground) to get the data that would be further processed.
While replaying the recording, I sent the voltage difference between the red and black clips into computer with MATLAB (a programming software). Here is what I got:
You absolutely cannot tell where the heartbeat is. I need to clean this up a lot.

2. Process the voltage data so it is perfectly clear when the heart is beating
Like I mentioned in Biomechatronics II: Move Things with Your Muscles, converting a signal from the time-domain (the domain you'd expect real-time data to be in) into the frequency-domain makes it easier to decide where your signal is (what frequencies you want to keep), and where your noise is (what frequencies you want to get rid of or filter out).

The voltage difference between the red and black split ultrasound recording signal. Looking at the bottom image, the left part (at lower frequencies in the green square) is the fetal heartbeat signal. The right part (at higher frequencies in the red square) is growing as the frequency increases. This is violet noise, and I want to filter it out.

Colors of Noise
Quick aside, what is violet noise? You are probably familiar with white noise. What's the difference? The frequency distribution of those sounds!
White noise is pretty even in magnitude across frequencies while violet noise increases in magnitude as frequency increases. There is also pink noise, brown noise, and basically every other color. And they each sound different because they are made up of different frequencies.
Note: if you click on the links above, you can hear recordings of each color and hear the difference yourself!
Now back to it.
By Googling around, I learned that the fetal heartbeat sound is restricted to between 60 and 200 Hz (the lower, left-hand frequencies in the figure above). So, first, I added a high-pass filter. This is an arrangement of electrical components that, when applied to a circuit, gets rid of everything that is below a set cutoff-frequency seen in the frequency-domain plot. It leaves everything that is above that cutoff-frequency (it lets the high frequency pass — it's a high-pass filter).
I added a high-pass filter with a cutoff of 60 Hz to get rid of low frequencies that were not caused by the sound of the fetal heartbeat.
Then, I added a low-pass filter with a cutoff of 200 Hz. This, as you may have guessed, gets rid of everything above a set cutoff-frequency and leaves everything below that cutoff (lets the low frequency pass).
In the unfiltered plot [top], you cannot tell when the heart it beating at all. In the filtered [bottom], you see spikes that correspond to when the heart is beating!

Unfortunately, high-pass and low-pass filters aren't perfect.
Just because I set the cutoff to a particular frequency does not mean that the data at frequencies I meant to keep will not be affected. When I set the cutoff to 60 Hz for high-pass, some stuff just above 60 Hz will get diminished in it's magnitude on the frequency-domain plot. Even more, when I set the cutoff to 200 Hz for low-pass, some stuff just below 200 Hz will get diminished in it's magnitude on the frequency-domain plot.
In these frequency-domain plots, the peak magnitude of the original, unfiltered data at a particular frequency [top] is much larger than the peak of the filtered data at the same frequency [bottom].

This diminished peak magnitude translates to smaller voltage changes in the time-domain plot.
The voltage amplitude of the original, unfiltered data [top] is much larger than that of the filtered data [bottom].

Later, I will set a voltage threshold above which the LED turns on. This voltage threshold will be much harder to establish if I am dealing with smaller millivolt changes as opposed to larger volt changes.
To increase or amplify my filtered signal, I added an operational amplifier circuit. This arrangement of electrical components uses an operational amplifier (op-amp) and a few resistors to do this:

It takes the signal at a smaller voltage amplitude [left] and turns it into a signal with a larger voltage amplitude [right].

Finally, I added the magical envelope detector. As I explained last time, this arrangement of electrical components takes very shaky input data and outputs data that just skims the top of the shaky stuff.
Here's a refresher of what an envelope detector does. The blue line is what I had before envelope detection. The red line is what I have after envelope detection.

The result was only positive voltage increases with each fetal heartbeat.
This is the fully-processed audio signal. I decided that a reading above 0.66 volts corresponded to a heartbeat (indicated by the blue markers). The data was recorded for 30 seconds, and there are about 90 peaks (3 beats per seconds is appropriate for a fetal heart).

3. Quickly blink an LED when that data says the heart is beating
I input the processed data into an Arduino (a microcontroller or a really small computer). I programmed the Arduino to look at the processed data and decide whether the heart was beating or not (whether the voltage was above my threshold of 0.66 V or not) — just like in the last project.
If it decided that the heart was beating, the Arduino sent a short 5-volt output to an LED circuit, thus blinking the LED for 40 milliseconds per beat.
If you listen closely, you hear the original ultrasound fetal heartbeat recording playing in the background. You also hear that the LED blinks in tune with the heart beating!
Here's a quick recap:

Thank you for reading!
If you missed them, check out Biomechatronics I and II.
I have one more biomechatronics project left: my robotic gripper.
Then, onto some computer vision!
Wow thats really cool! Converting sound to a visual pulse.
Thanks for sharing :)
Thank you @buildrobotics :D
This is so nerdy. But I like it.
Hahaha nerdy is what I know best @choogirl. Glad you like it :)
Cool research @jshmu, hope there's more to come!
Congratulations @jshmu! You received a personal award!
You can view your badges on your Steem Board and compare to others on the Steem Ranking
Vote for @Steemitboard as a witness to get one more award and increased upvotes!