EOS technical analysis 24/07/2018
Over the last year, I have been introduced to Elliott Wave Theory and have learned to use it in trading cryptos. More recently, I have looked into the more specific "Fibonacci Pinball" method described by Avi Gilburt's group. I have never subscribed to any of their services, but they have an Education section of their website, which includes an introduction to their Fibonacci Pinball method as well as a more detailed presentation on the topic.
I have decided to practice their method and use this blog to document my analysis for my own purposes.
I am not a financial advisor. Do not consider this to be financial advice. I am posting it here for my own practice and future review only.
Let’s take a look at EOS. In the short term I am looking for it to break out of the downward channel and likely retest it.
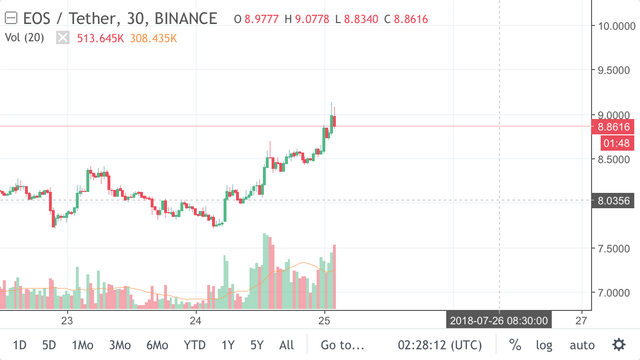
I made the above chart a few hours ago, and since then EOS has indeed continued to rise, going over $9. I think it has a little more room to run on this first impulse. If it overshoots the $9.33 first target above, I would expect $9.75, with subsequent targets increasing accordingly.

Zooming out, the late April high projects long term overhead resistance to be broken on the way to a wave (v) high around $49.50.
If we work off the January high, we get pretty good consistency, with a target of about $47.50 for the same wave (v), on the way to a target of $58.85 for circled wave v.
.
If you enjoyed this post, please consider an upvote, follow and/or resteem.