Ethereum Weekly Price Forecast! Everything says "BUY"
Here is a go-through for the ETH/BTC price action that has started a bullish trend following a major retracement from ATH.
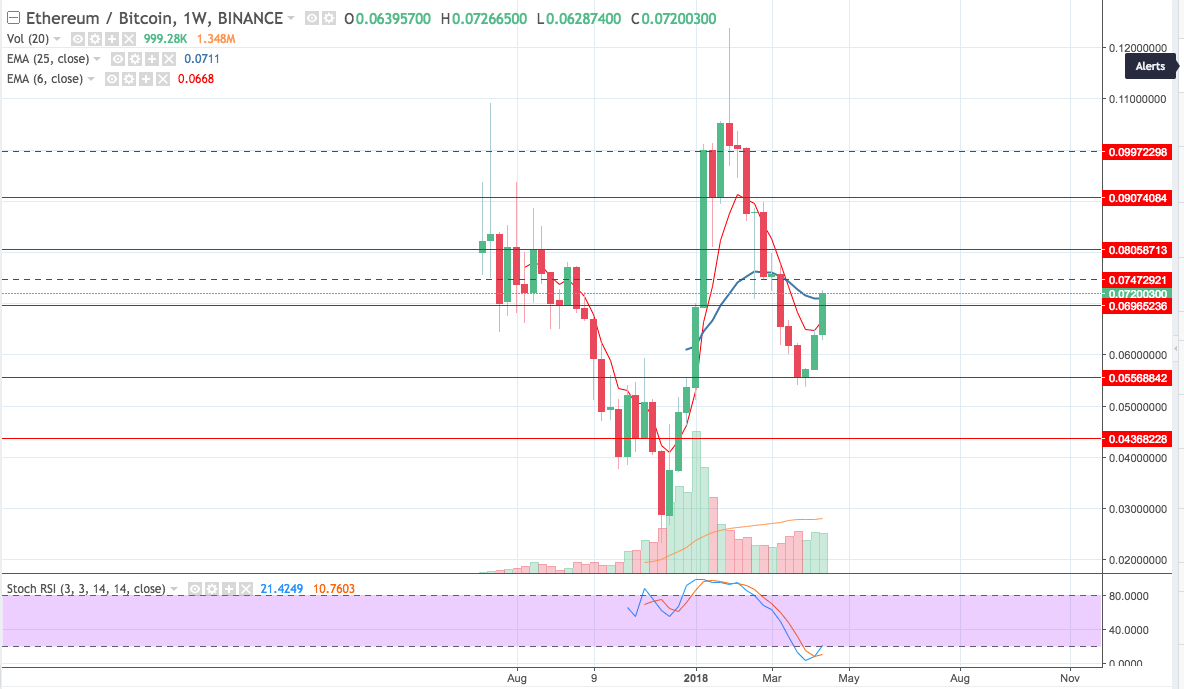
On the Weekly Chart: As it is clear from the image below, ETH has bounced off a very low support at 0.055 BTC where it was trading below both fast and slow moving averages ( red and blue curves) . ATM , price has bounced off strongly from the said support and has broken the resistance at 0.069 and in few hours the weekly Candle will probably close above both moving averages, signaling the beginning of a new long uptrend. Above all, the Weekly Stochastic indicator indicates a strong upwards crossing , which supports a long term uptrend!
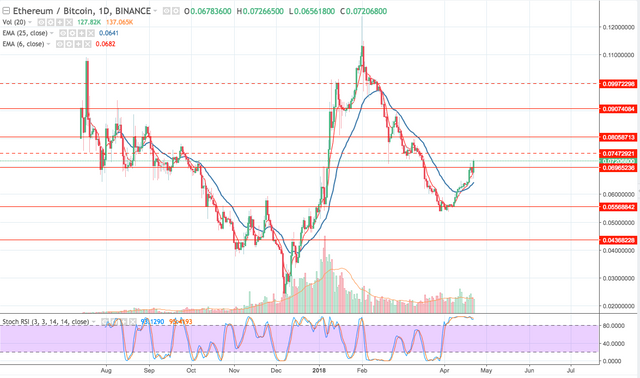
As for the daily chart: Expect some correction/ retracement along the uptrend specially around the support/resistance lines ( full line = strong ; Interrupted line = weak ) illustrated in the image below . Despite Stochastic being near overbought zone, this may stay in the zone for a while noting that the stochastic MA's have a "flat" movement with no crossing signs
Conclusion (Personal Opinion Not a trading advise) , ETH is an an excellent buy position for long term,