Zane's Crypto Recap: ETH (Ethereum) June 16, 2017
Zane’s Crypto Chart Recap: ETH June 16th, 2017
Welcome back everyone! Thanks for upvoting and engaging in yesterday’s STEEM Recap.
I’m excited to share with you my thoughts on the ETH (Ethereum) chart.
I suspect this is a favorite among the community so let’s dig in and see what the chart is telling us and find some key levels to watch for entries and exits so we stay on our toes and make the most of this wonderful opportunity we have.
Quick Take:
As of 16:45 on June 16th, 2017 (GMT+6 hours)Price: $345
$USD 24 hour change: +9.06%
$USD Weekly change: +29.46%
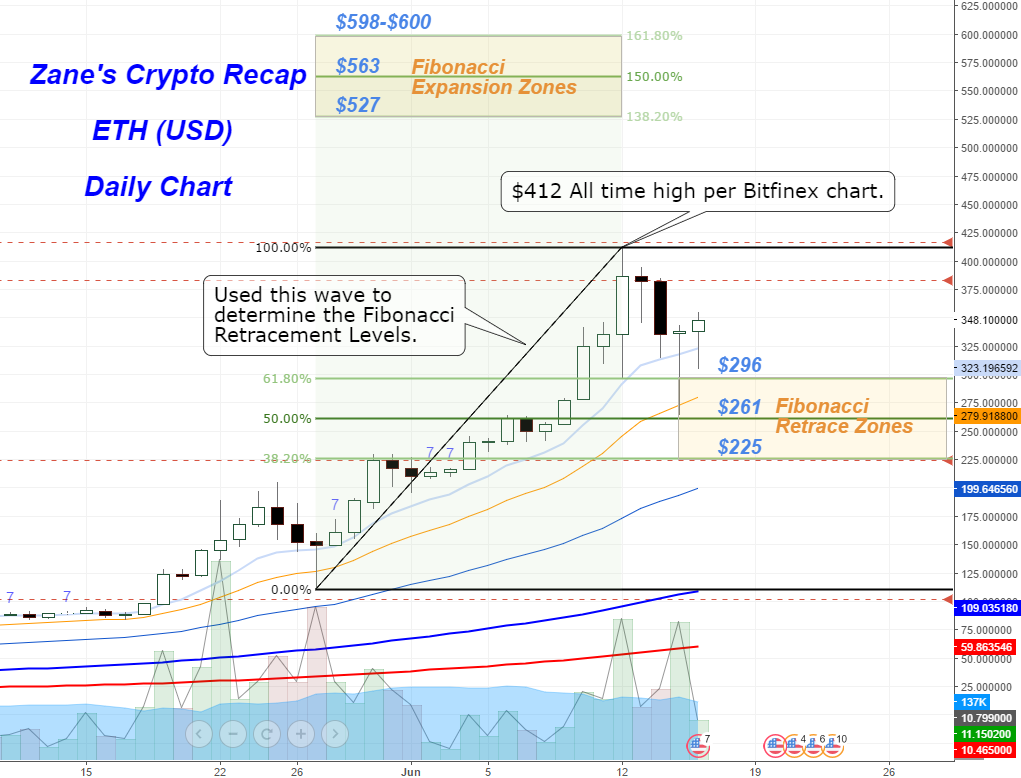
After the pullback yesterday we see ETH still holding key Fibonacci levels and the critical 20 EMA.
As long as these levels hold we expect the trend to continue. A fall below the 20 EMA and then all that is saving the trend is the 50 EMA. I’ll keep you posted on any trend breakdowns.
Until then, let’s look for entry locations.
Entry Locations:
$296, $261, and $225 are all great areas to look to enter this trend on a pullback based on Fibonacci Retracement levels.I found these entry prices using Fibonacci Analysis. It is used to help locate POSSIBLE areas of retracements. They aren’t to be trusted 100%, but with so many people using them they become sort of a self fulfilling prophecy and work remarkably well. Here is a link to Investopedia.com for more on the topic.
The Fib’s I will use will be the 38.2%, 50% and 61.8% retracement levels.
The daily 10 EMA and 20 EMAs are great locations to enter a bull trend as well to avoid chasing your entry.
Upcoming Targets:
The All time high (ATH) of $412 is our first target. Expect some choppiness around that level but don’t be surprised if we blow right past it! It's just the way the market has been lately, seemingly unstoppable.If $412 gets taken out to the upside then our next targets are:
138.5% Fib = $527
150.0% Fib = $563
161.8% Fib = $598-$600
Downside concern:
If we start to trade back down to the $225 level and don’t bounce relatively soon then it is safe to say the trend is shifting from “bullish” to “bullish/neutral”. Still a great trend to be in, but now with muted expectations at that point until we see some volume coming in to propel another wave higher.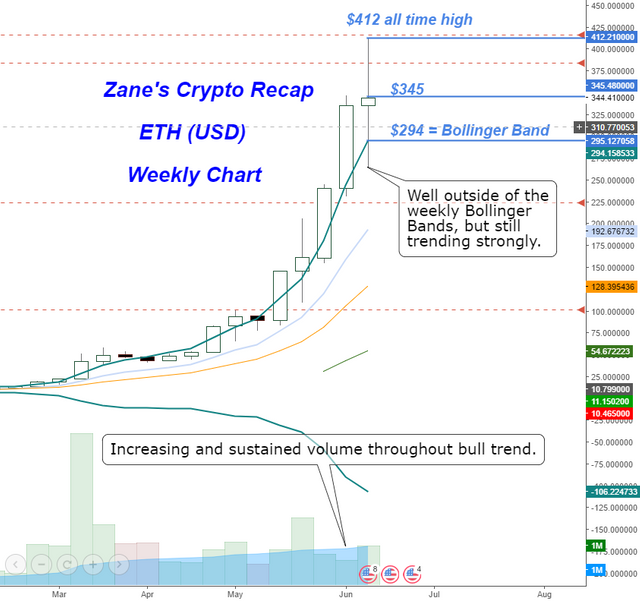
ETH is clearly in a full blown bull trend. Volume has increased consistently throughout the entire bull trend, which is a great signal.
The weekly chart does look a bit extended from the Bollinger Bands so to me a rest seems imminent, perhaps for a couple weeks just to let this super charged trend cool off a bit. Not saying the trend is done for now, but just to be careful if you are buying after a huge run has occurred.
Hope all you Steemians enjoyed this recap!
Stay Tuned and upvote if you would like to see more Crypto Recaps.
What’s on the Chart?
Light Blue = 10 Exponential Moving Avg
Orange = 20 Exponential Moving Avg
Green = 50 Exponential Moving Avg
Thick Blue = 100 Simple Moving Avg
Thick Red = 200 Simple Moving Avg
Horizontal lines = Support/Resistance areas
What’s Next on Zane’s Crypto Recap?
I plan on releasing a detailed chart each day on a rotating schedule. I will alternate between STEEM, ETH, BTC, possibly DASH or other Top coins.
I will also include in the rotation the most requested coin in the comments below.
So let me know what coin you would like to keep track of and let’s stay on top of this super exciting market together!
Request your favorite coin in the comments now!
See you tomorrow,
Zane