Ethereum daily update 02/07/2018
Good evening everybody,
The market has been recovering in the past 24 hours and some are saying it's due to sentiment from SEC W. Congress meeting. I'm thinking it's a combination of the positive outlook the SEC has presented to Congress about crypto currency. Another probability is that the people who pulled out when the "stock market crashed," may have re allocated their funds into other investments. Maybe crypto. Either way, I see in the short term there will be difficulties for ethereum, Bitcoin, and litecoin to get back up to all time highs. But I do believe eventually they will get there and continue the move upwards to form new all time highs.
I want to take a look today at ethereum in a multiple time frame analysis. Meaning we will use multiple charts to determine ethereum's next move and areas of support/resistance.
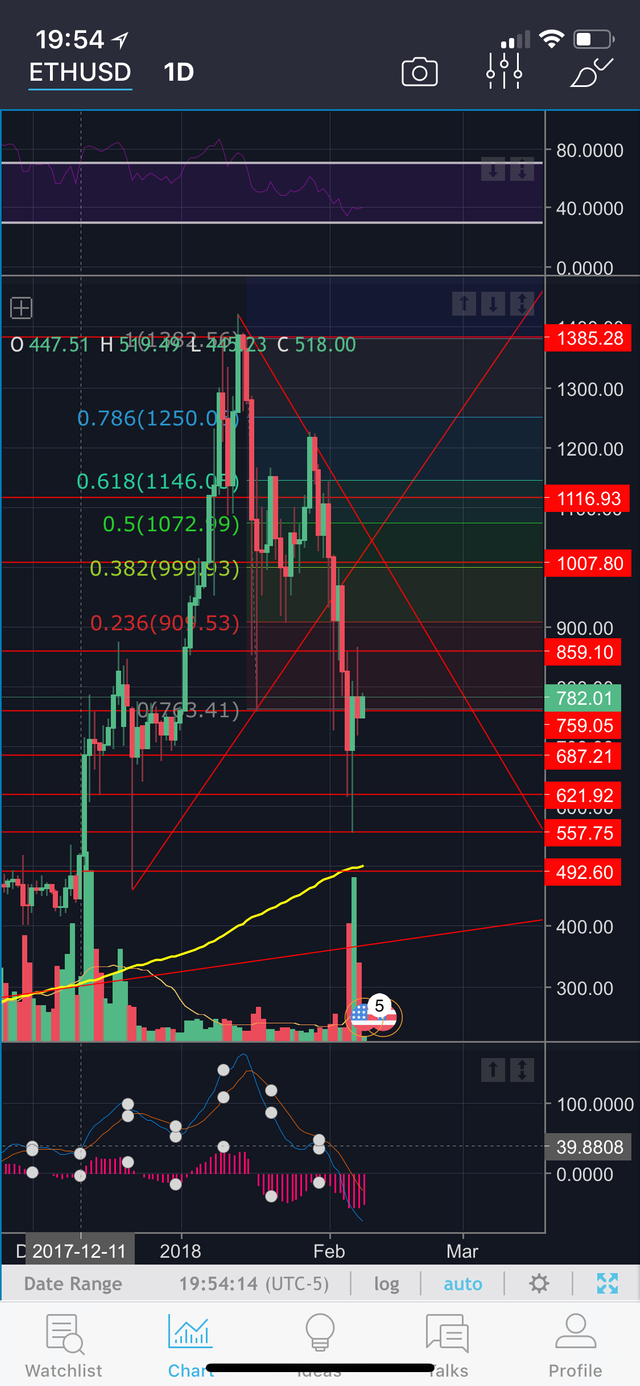
Ethereum hit a monthly low of 557~ two nights ago, however has made a decent recovery since then. Ethereum is currently floating around 780~
On the daily chart, the RSI is bouncing off the oversold area, and seems like it's pulling up. Again, there's going to be some sort of difficulty pulling up. From the lows, ethereum has made a run up to 859~ where it was a previous support area, now turned resistance. MACD histogram is following the price movement upwards which is a good sign, however it has not crossed the 0 area into positive territory yet.
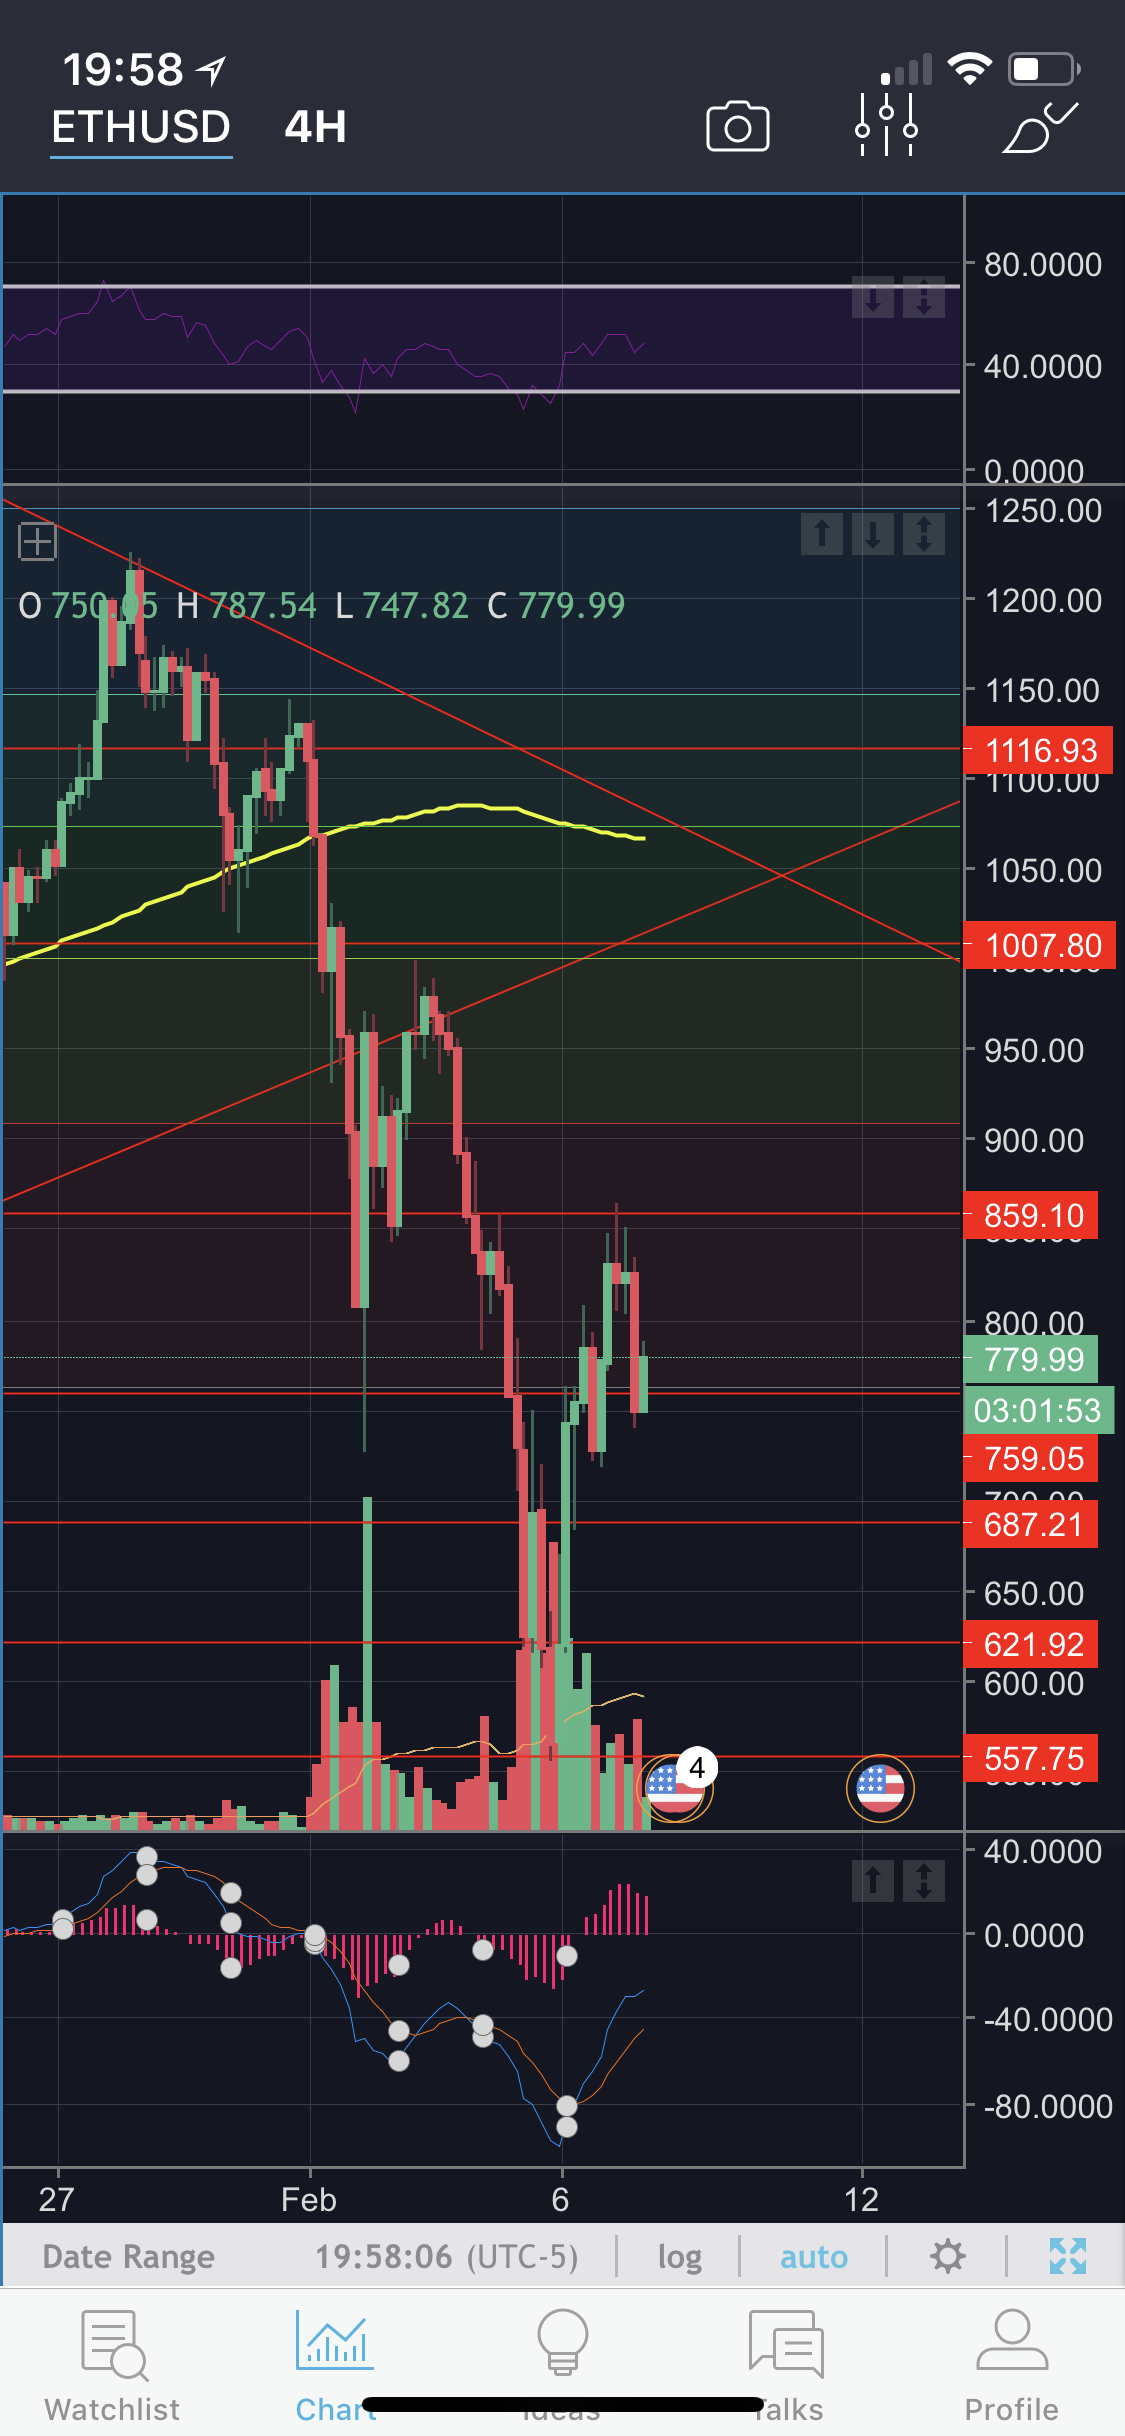
Dialing down to the 4 chart, we see that the volume in the upwards moves has been heavy and has continued with more volume. Signaling that this move up should follow with momentum. But again, we notice that there is a huge resistance area at 859, however also a support area at 759, once ethereum crosses 859 with a solid bullish candle it should be on its way back to 1007, and after that, to 1116~
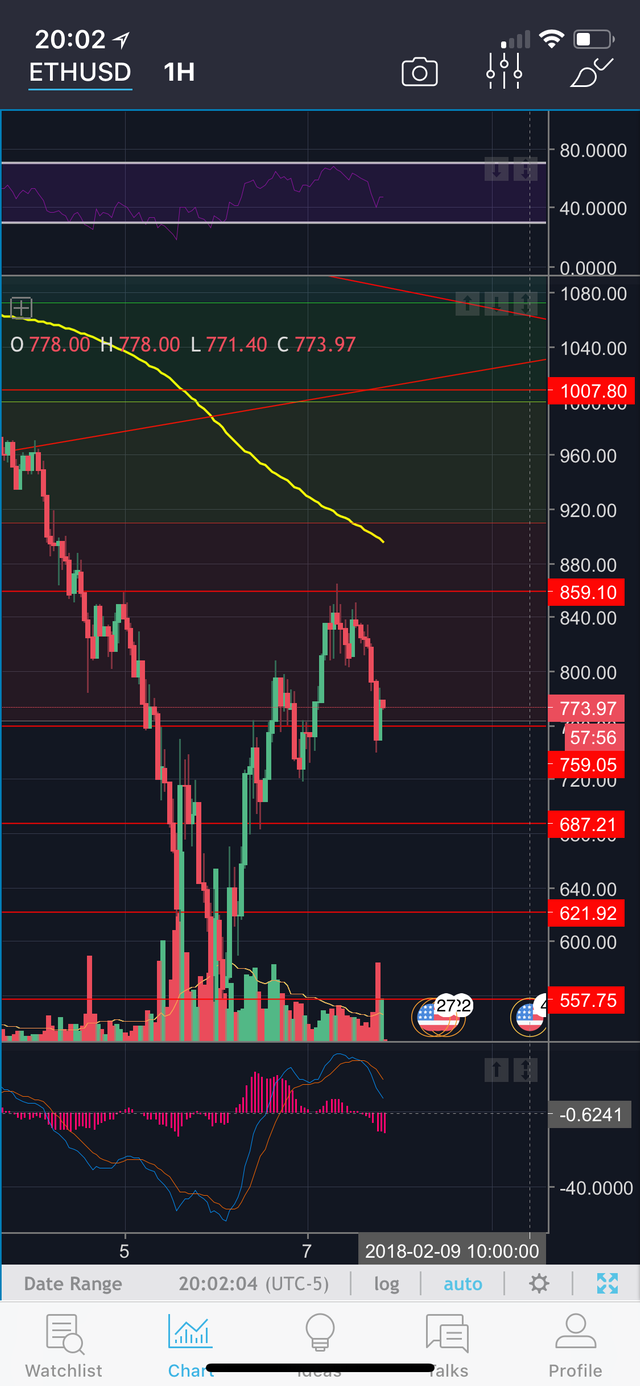
When we dial down even further to the entry chart, we see that ethereum's move down from the resistance area at 859, isn't followed with much sell volume. It seems since it touched 859~ that it fell back down but not with any momentum to the move. Again, ethereum and the other big 2 have a lot of work to do to be able to reach to the stars and then the moon.
However I am a long term investor only doing a few day trades and swing trades here and there when I can recognize them.
On the hourly chart, ETH will also have trouble at the 200MA line and will struggle to move past 900, but again, once a solid bullish candle breaks through it, it will be heathily moving back up.
Ethereum out of the big 3 currently has the best outlook with a bunch of dApps being built on it, and with some of the fastest and cheapest transactions out of the big 3. (litecoin is still cheaper and faster I believe) I'd be very cautious to enter any positions right now. I see that the market can easily go down and hit the daily 200 MA at 492~, but if it does I expect it to be a flash crash down to 492~ and a quick recovery to current levels at 776. We'll continue to watch the volume and momentum for these next few days to confirm anything. Short term outlook for 12-24 hours is bullish. Long term for a year bullish, medium term for the next week is bearish.
Disclaimer: This is my, Lee's Investment, own analysis of the CryptoCurrency chart(s). These are not to be taken as Certified Financial Advisor positions. Take these trades at your own risk. Lee's Investment, is not a certified advisory firm, and is only providing information for educational purposes. You are required to perform your own due diligence to take these trades. You should always check with your licensed financial advisor and tax advisor to determine the suitability of any investment.
Thanks, with this post' im learning more about ETH!
No problem! I'm glad you're learning more!