Ethereum pattern revisted, strap in for profits
If you've been following crypto for awhile you'll know that pattern repetition is very very common and a great way to pinpoint the trend in this extremely volatile market.
Months ago, myself and a close group of traders identified some basic patterns in coins and were able to chart out excellent entry and exit points. For a brief time the pattern broke as we entered the very chaotic holidays and the alt coin boom.
I believe we are reentering a predictable main coin pattern. See if you can see what we are seeing below:

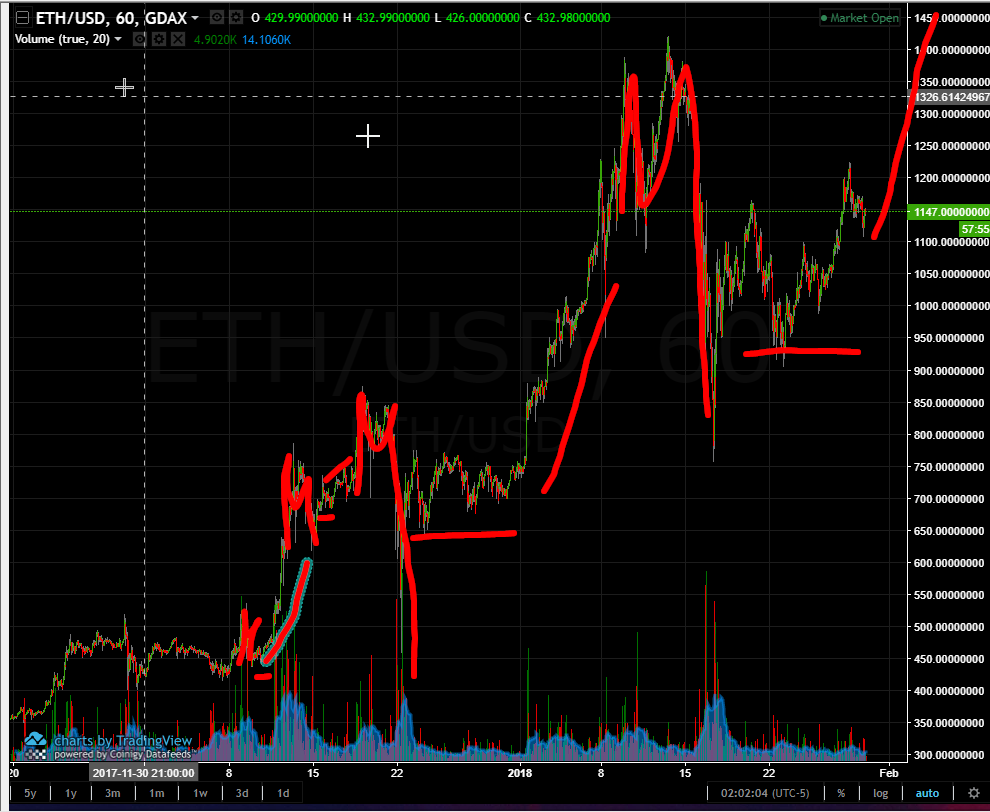
This is ether on a 1 hour chart.
I would say there should be confirmation of the main pattern repeat over the next day.
This is my first post, so bear with me. I'll be looking to put up more detailed technical analysis of the crypto market and reviews of fundamentals and trends. I just wanted to get this out there as a trial to start.
thanks for viewing and upvotes are appreciated :)
Can you explain in more detail what pattern you have seen and suggestions for entry and exit points based on the patterns?
Ethereum seems to be one of the more consistent coins in it's pattern. Thru most of 2017 while bullish it would repeatedly dip below previous support immediately to rebound. This made entries easy on the down turn once it dropped below support with a strong upswing anticipated after. As of late it's kept some of these overall properties, but is a little harder to find worthwhile entries and exits on due to the overall liquidity it's reached at this stage in the game. However if you watch the pattern you will see ETH is notorious for large impulses, and these make great indicators for where in the chart you are currently. If you follow along from these impulses you'll see that Eth has a very difficult time maintaining price after reaching new highs for long periods. Almost every ATH is followed by a very dramatic correction. Two GIANT M's in the middle of the circles shown are great examples in this pattern of this. Utilize the clear repeats of these to gauge an entry/exit.