ETHUSD - Technical Analysis November 14, 2017 - Current Price $325

ETHUSD - Day Traders Chart Setup
Moving averages:
Green = 50dma
Red = 200dma
Orange = 9ema
Black = 20ema
Continuing with the theme of using the Day Traders time frame to track these tickers due to recent volatility lets look at ETHEREUM.
In a previous analysis our call was to go long if the price could break above the $305 level and ETHUSD is currently trading at $325.
The price targets, bearish below, bullish above are trading thresholds which I provide in the hopes that these are trading opportunities.

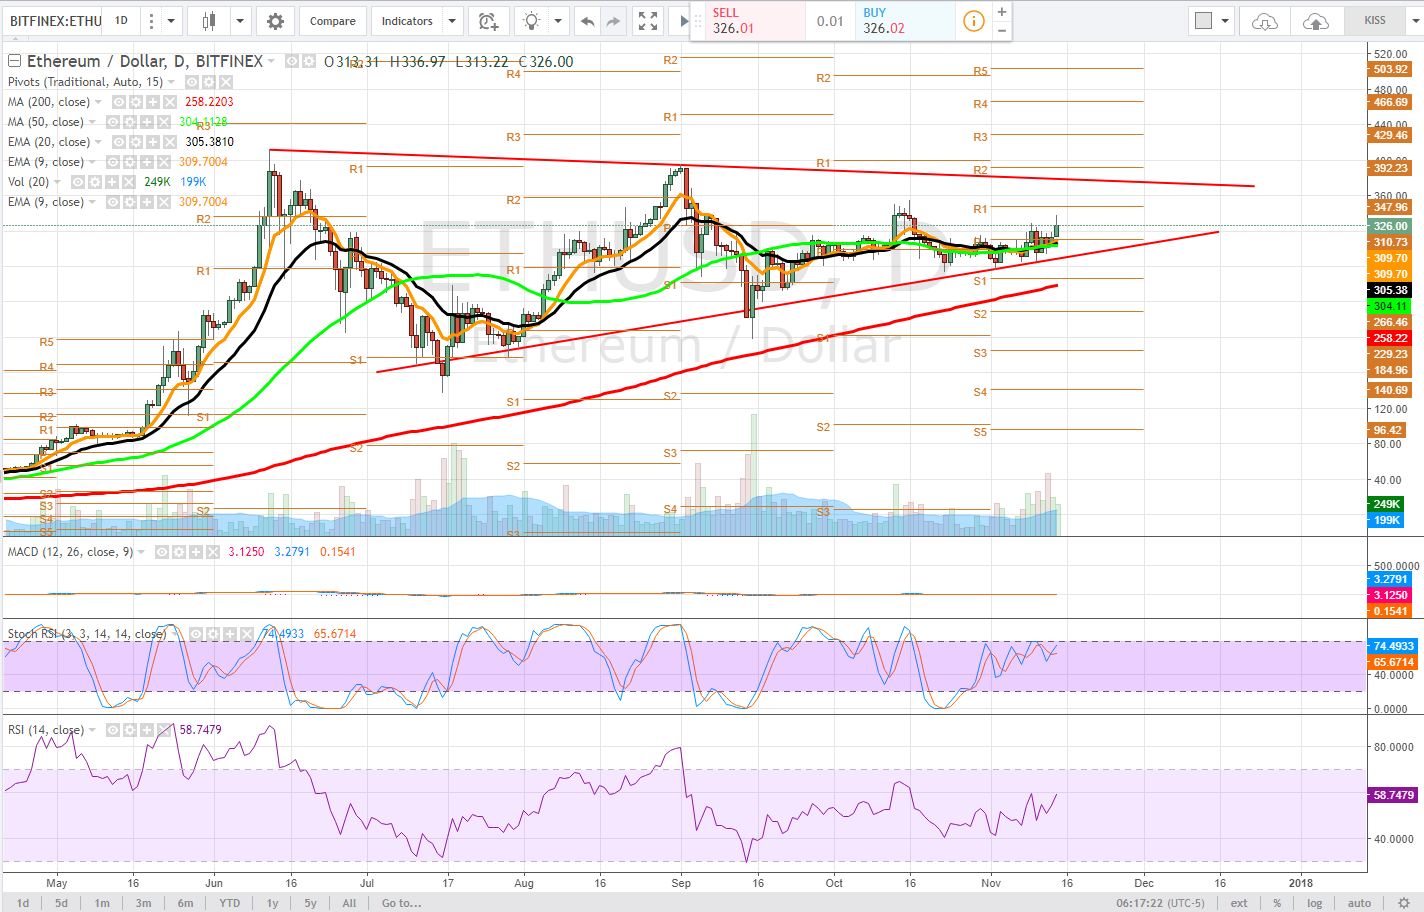
Daily
On the daily timeframe we are tracking a clear pennant formation waiting for it to break one way or the other. Our current optimistic target, is a test of the upper trendline which is currently in the $380. Bulls will need to get the price above $350 which is a psychological resistance.
The stochastic RSI has been grinding higher as the convergence of moving averages seems to be pushing in favour of the bulls with the 9ema & 20 ema pushing above the 50dma. This is all happening at the daily pivot support a level bulls need to continue to hang on to.
If the price pullback this is a must hold level or the price could test and break below the lower trendline. The MACD is flat because the momentum is just not there - this actually means the price is coiling for a move in either direction. The RSI itself is still within a healthy range and we will keep our eye on it.
If the price fails to hold the lower trendline, look for a dip buying opportunity at the 200dma on this time frame.
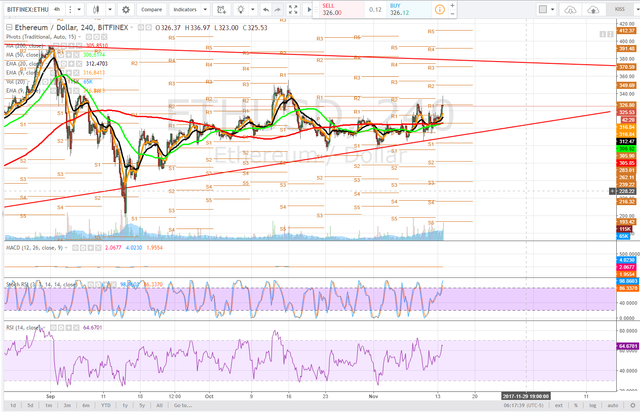
4 hour
The 4 hour is showing us what is known as a golden cross, 50dma above 200dma and is typically a very bullish development. However, the current candlestick has wicked to show us a doji after finding resistance at the previous periods pivot R2. The price is now testing and seemingly unable to hold the current pivot R2 level, $326. The price is likely to pullback as the stochastic RSI has become extended into uptrend and taken in combination with this the current chart and candlestick patterns we look for the 9ema and 20ema to provide price support.
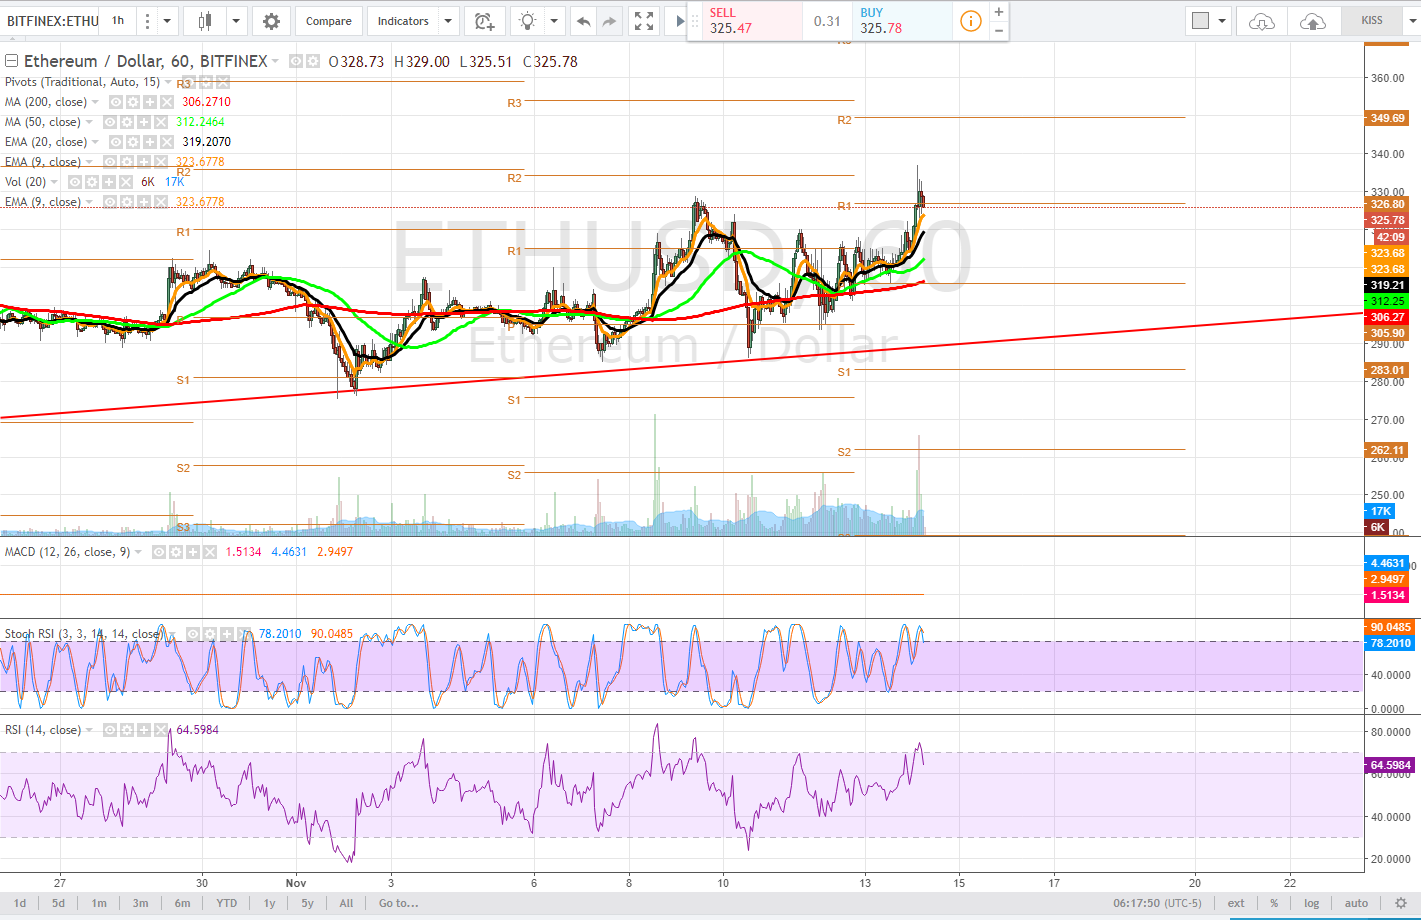
1 hour
On the 1 hour time frame we see the RSI did reach overbought territory before correcting and coming back down below the 80 line as the stochastic RSI has produced a bearish cross and it pointing down. Price consolidation seems important here with the price currently testing the 9ema and could trend lower all the way to the 50dma on this time frame. If the 50dma fails a retest of the pivot $305 range is likely but additional support will be observed with the 200dma converging at this point.
Bullish Above: $327
Bearish Below: $304
RISK TRADE: Scale long here adding all the way to pivot support at $305, sell if the price breaches this level and look to re-enter lower.
Don't forget to use stop losses!!!
Previous Articles:
BTCUSD
BCHUSD
BTCUSD
ZECUSD
XRPUSD
ETHUSD
BTCUSD
BCHUSD
Follow at your own risk, Not a financial adviser, understand the risks associated with trading and investing. Manage your own Risk - in other words you could lose it all and it's your own fault.

OK
really? OK all you got? So you can upvote yourself for some curation? Why not try harder?
It seems to me that altcoins will never stop falling ;( 4 months of dropping is making me tired.
They fall in the BTC pairing.
Great report Satchmo, helps me loads. It is always nice to do your own research and then get it confirms by a Star.
dawwww shucks!
Again, well done! Thanks for the analysis.
Thanks for this. But i At least 2 weeks there is resistance around 345-350. Strong resistance ı think. According to elliot wave principle Ethereum correction is still contunie. And this type of correction is really rare. Zigzag, and Triangle combined correction.
And this is the Combined correction.
Takes time, I tend to look for broader pattern nd think a pennant can be drawn here. doesn't denot direction per se. Just that explosive move comes - will be interesting. I prefer to play the channel than predict outcome. Also 350 is psychological level, will be tought not to crack.
I dont think so. I dont believe psychological levels. ATH for ETH is 400 so 350 could not be psychological level. I always trade with trend. But now ı ı can not see any trend on ETH. The correction is still contunie. I am waiting to buy some ether when it becomes to uptrend again.
round numbers are psychological in trading always -- but especially in crypto.
I mean ATH 400 $, so 350$ cant be psychological level now.. But 450$ can be. I have very different system my friend :) I am trying to learn astrofinance at the moment . I am working to understand william d. gann's theory. so classical TA is different for me. but I respect you on your way :)
By the way ı am here to learn something new. So thanks for your sharing.
thanks a lot for sharing the work!
I m a bit more long term. I see a consolidation pattern (metaphorically it would be a spring getting tighter waiting to explode) in the past few weeks. Much more upside here than down, so let's load up and have a stop loss, may be at 290.
well now we are seeing the benefits of the consolidation. the longer the consolidation, the more powerful the breakout. we were in the low 300s, now more than doubled (we are int he mid 600s)...
This is a little off point, but could you do an analysis like this for XRB? I love your work @satchmo
Maybe ill do a compiled post about some alt coins for everyone 😃
Thank you for sharing this analysis
Im already in long since last 2 days 👍👍👍
Nice!
wow really grate post @satchmo