Trading Cryptocurrency with Advanced Fibonacci / 23.09.2018 (ETH)
Let's try to look at ETH also. I rarely trade other cryptocurrencies rather than bitcoin with leverage.
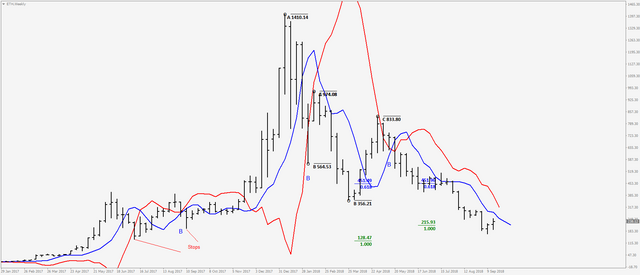
Looking at the weekly charts; market showing thrusting action here. Weekly trend is down. The market has taken the stops below 196 and now showing a pullback. There are more stops lower below the 132.
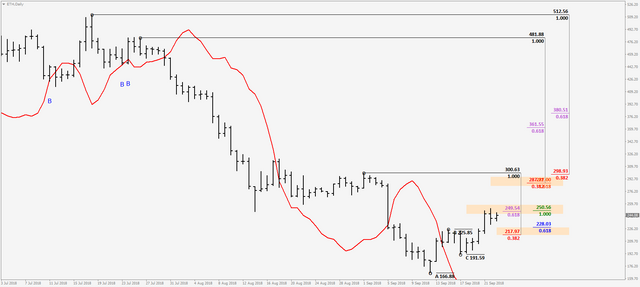
On the daily; market testing agreement resistance zone at 250 recently. There is another good agreement resistance zone higher up at 287. These are the resistances that we wıll be looking at so keep a close eye on it. After such a down thrust on weekly; you can expect that first or second resistance to get sold.
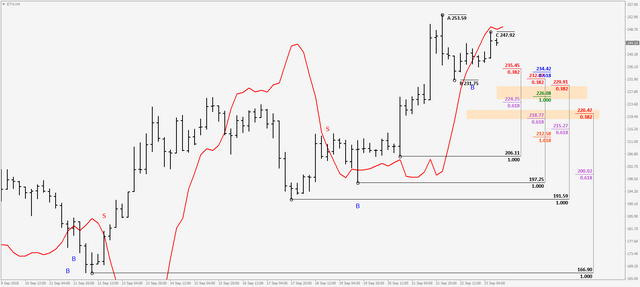
Zooming down to 4hr chart; We see poor DP on sell signal. We have good agreement and confluence support levels. This can be risky to long the market with weekly down thrust and trend against us but I m still expecting the market to see the 287 retracement first and then shows a decent pullback. So If you prefer to long the market at 4hr at appropriate support levels you need to drop lower timeframes to watch for dynamic pressure. If you cant get it you need to look for ways to exit the position immediately.
Note: Please re calculate all fib levels on your trading exchanges.