Horizontal(trend) analysis of financial statemts
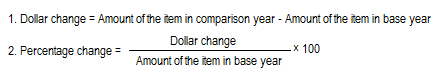
Horizontal analysis (also known as trend analysis) is a financial statement analysis technique that shows changes in the amounts of corresponding financial statement items over a period of time. It is a useful tool to evaluate the trend situations.The statements for two or more periods are used in horizontal analysis. The earliest period is usually used as the base period and the items on the statements for all later periods are compared with items on the statements of the base period. The changes are generally shown both in dollars and percentage.Dollar and percentage changes are computed by using the following formulas:
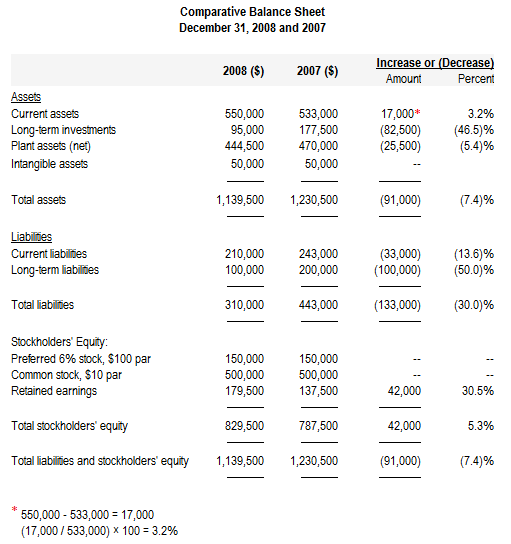
Horizontal analysis may be conducted for balance sheet, income statement, schedules of current and fixed assets and statement of retained earnings.
Example: