XAU/USD Triangle, Continuation Pattern Forms After Bounce
XAU/USD Key Points
- Higher time frame bullish trend.
- Price flags back into support zone and bounces.
- Now forming a triangle, continuation pattern.
XAU/USD Technical Analysis
Monday morning and markets are open again. How good is is when you look forward to getting work done first thing to start the week.
THIS is is the essense of trading!
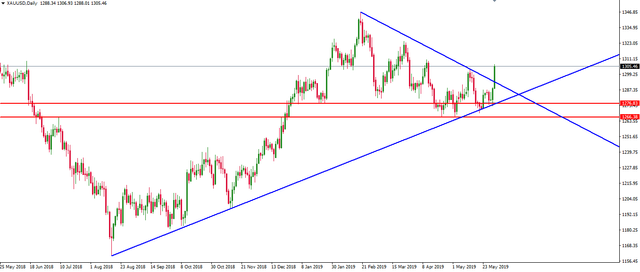
So, in my last gold daily analysis piece, I spoke about the commodity pulling back into a previous resistance zone that we were looking to turn to support.
Let's take a look at the updated charts:
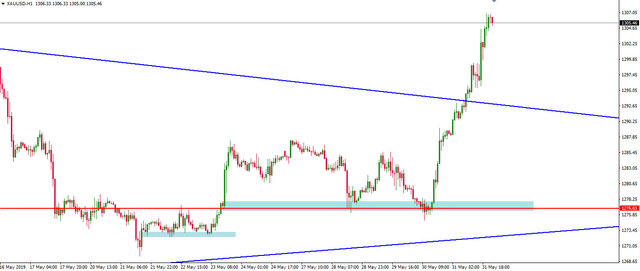
First up, take a look at the hourly. If you don't remember that first, short term support zone we were watching, then click the link to the previous gold analysis piece and take a look.
As you can see, price held both that zone and the next short term zone that we talked about on Twitter.
Now take a look at the second chart, with the huge daily triangle. Trust me, you wont be able to miss the triangle that I'm talking about!
Price has now broken out of the triangle and absolutely ripped faces off in the process. The complete lack of pullback showing the strength of the breakout.
Now, if you're not in already, I'm probably leaning toward this run probably having exhausted itself a bit here.
I'm the type of trader that likes to wait for a pullback and that's what I personally want to see before doing anything else with this one.
There are however, multiple ways of trading this one and I'm sure a few of you have your own strategies on how to tackle this one.
Best of probabilities to you.
Dane.
Upcoming Economic Releases
- USD ISM Manufacturing PMI
- AUD Retail Sales m/m
- AUD Cash Rate
- AUD RBA Rate Statement