FOREX correlation and causality
Consider the seven major currency pairs, sampled hourly over the last six months. We calculate the pairwise Pearson correlation coefficients to determine the degree with which each pair “moves” together:

Values near one or negative one indicate high correlation, values with lower absolute value less so. Positive values indicate movement in the same direction; negative values movement in the opposite direction. For example, we see with when the British pound increases against the U.S. dollar, the Euro will likely also increase with respect to the U.S. dollar. By contrast, we see that change in the U.S. dollar with respect to the yen holds little correlation with the Australian dollar’s movement against the U.S. dollar.
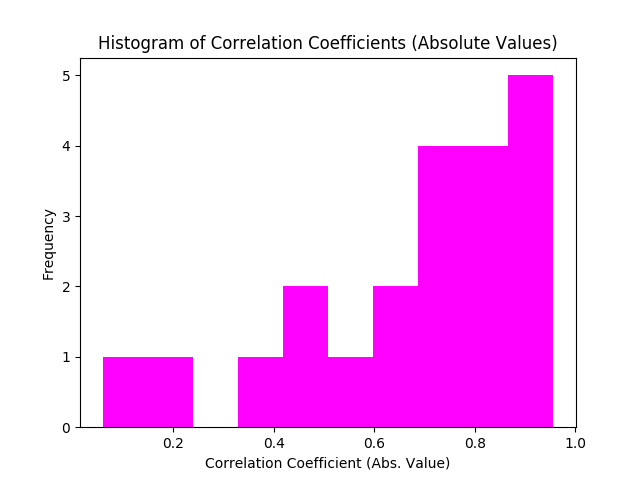
For perspective, here is a histogram of the absolute values of the correlation coefficients:

Correlation is fine and all, but I’m really interested in causality—whether a pair’s movement forecasts another pair’s movement by a specific range of hours. (We’ll ignore the philosophical issues regarding measurement of “causality” for this discussion).
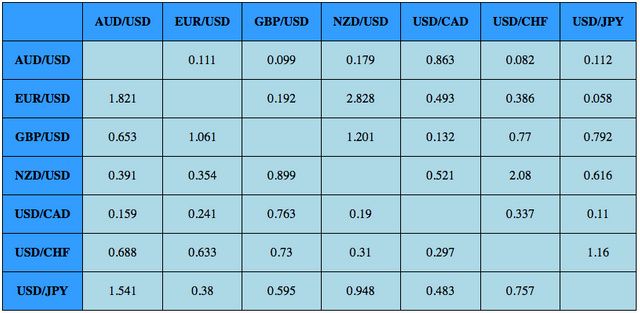
So I devised a scoring metric based on Granger causality applied between one and 24-hour lags. (The details are “secret sauce”—trade secret). Applying the scoring metric pairwise on the data discussed above yields:

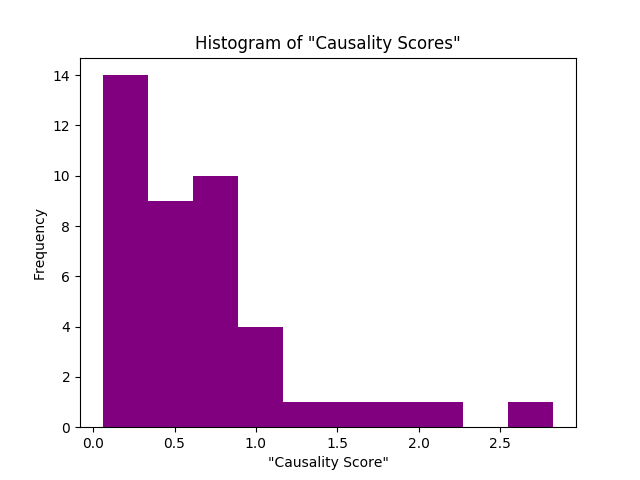
The higher the score, the general predictive quality of the first pair toward the second pair over a 24-hour period. The distribution of these values is:

All this work informs strategic model building.