Trading Forex with Advanced Fibonacci / 20.08.2018 (GBP/USD)
Looking at the GBP/USD;
Market is sitting around yearly 0.618 (COB) Fibonacci expansion support levels at 1.2429 and 1.2457.
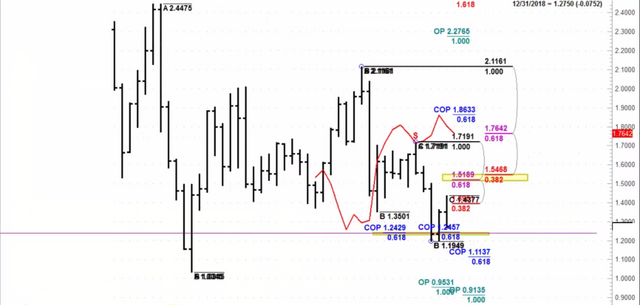
We dont see a follow through on the macd quaterly trend change which shows very week dynamic pressure.

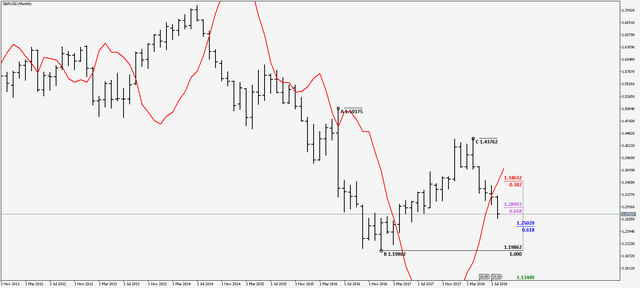
On the monthly; Trend turned into sell and market is pushing through 0.618 (F5) Fibonacci support level at 1.2899. Beneath that 0.618 (COB) monthly expansion at 1.2502 will stand as the next support which the market will likely test it.
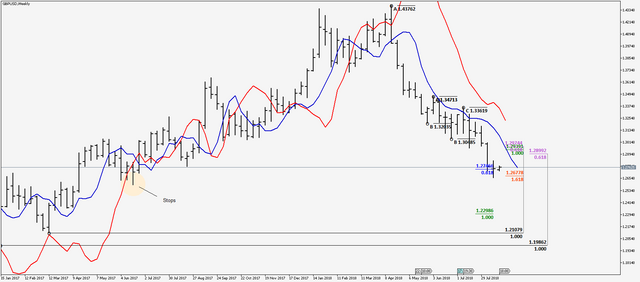
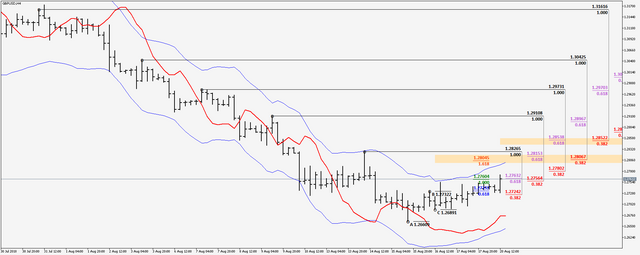
Looking at our weekly; We see a down thrust (Min 8 bars below 3*3) and the market is testing cluster (0.618 COB + 1.618 XOP Fibonacci expansions) support zone at 1.2746 and 1.2677. Market may try to take the stop below 1.2588 level.
Daily; We do have a nice down thrust as well. Daily trend change is approaching. We have strong confluence resistance around 1.2970 zone. So that might be a good spot to fade daily trend against the weekly and monthly down trends as per standart trade plan. We might be able to get Dinapoli s B&B sell setup before that as well.
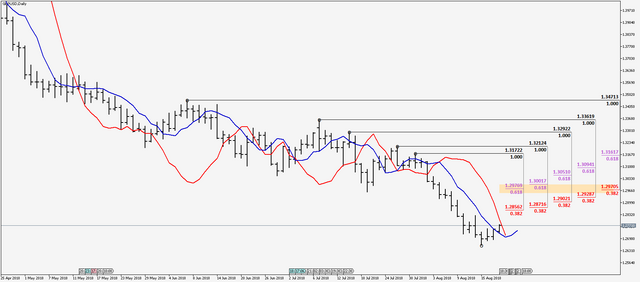
We drop lower timeframe to pinpoint our entry for possible B&B Sell Setup. We have nice agreement + confluence (1.00 OP expansion, 0.618 F5 and 0.382 F3 Fibonacci resistance levels) zone at 1.2804- 1.2815 zone and another confluence (F3+F5) zone higher up 1.2853-1.2857
Please take note of that we are around yearly fibonacci support levels so need to cautious while shorting the market.